KoolReport's Forum

Official Support Area, Q&As, Discussions, Suggestions and Bug reports.
Forum's Guidelines

Excel Pivot Table Error. #1336

Closed emre opened this topic on on Mar 6, 2020 - 10 comments

E
emre commented on Mar 6, 2020

Hi guys,

When I copy/paste example of https://www.koolreport.com/examples/reports/excel/pivottable/ this, The result comes empty.

index.php

<?php
require_once "MyReport.php";

$report = new MyReport;
$report->run()->render();

MyReport.php

<?php
require_once "/Applications/MAMP/htdocs/ytKoolReport/vendor/autoload.php";

use \koolreport\processes\Map;
use \koolreport\processes\Limit;
use \koolreport\processes\Filter;
use \koolreport\cube\processes\Cube;
use \koolreport\pivot\processes\Pivot;

class MyReport extends koolreport\KoolReport
{
    use \koolreport\export\Exportable;
    use \koolreport\excel\ExcelExportable;

    function settings()
    {
        return array(
            "dataSources" => array(
                "dollarsales"=>array(
                    'filePath' => 'table.csv',
                    'fieldSeparator' => ',',
                    'class' => "\koolreport\datasources\CSVDataSource"      
                ), 
            )
        );
    }    function setup()
    {
        $node = $this->src('dollarsales')
        //->query('select *, dollar_sales as dollar_sales2 from customer_product_dollarsales2')
        ->pipe(new Map([
            '{value}' => function($row, $meta) {
                $row['orderQuarter'] = 'Q' . $row['orderQuarter'];
                return $row;
            },
            '{meta}' => function($meta) {
                $meta['columns']['orderDate']['type'] = 'datetime';
                $meta['columns']['orderQuarter']['type'] = 'string';
                return $meta;
            }
        ]))
        ;

        $node
        ->pipe(new Limit(array(
            50, 0
        )))
        ->pipe($this->dataStore('orders'));

        $node->pipe(new Cube(array(
            "rows" => "customerName",
            "column" => "orderQuarter",
            "sum" => "dollar_sales",
        )))
        ->pipe(new Limit(array(
            5, 0
        )))
        ->pipe($this->dataStore('salesQuarterCustomer'));

        $node->pipe(new Cube(array(
            "rows" => "productName",
            "column" => "orderQuarter",
            "sum" => "dollar_sales",
        )))
        ->pipe(new Limit(array(
            5, 0
        )))
        ->pipe($this->dataStore('salesQuarterProduct'));

        $node
        ->pipe(new Filter(array(
            array('customerName', '<', 'Au'),
            array('orderYear', '>', 2003),
        )))
        ->pipe(new Pivot(array(
            "dimensions" => array(
                "column" => "orderYear, orderQuarter",
                "row" => "customerName, productLine",
            ),
            "aggregates" => array(
                "sum" => "dollar_sales",
                "count" => "dollar_sales",
            ),
        )))
        ->pipe($this->dataStore('salesPivot'));
    }
}

MyReport.view.php

<?php
use \koolreport\pivot\widgets\PivotTable;
use \koolreport\widgets\koolphp\Table;

?>
<div class="report-content">
	<div style='text-align: center;margin-bottom:30px;'>
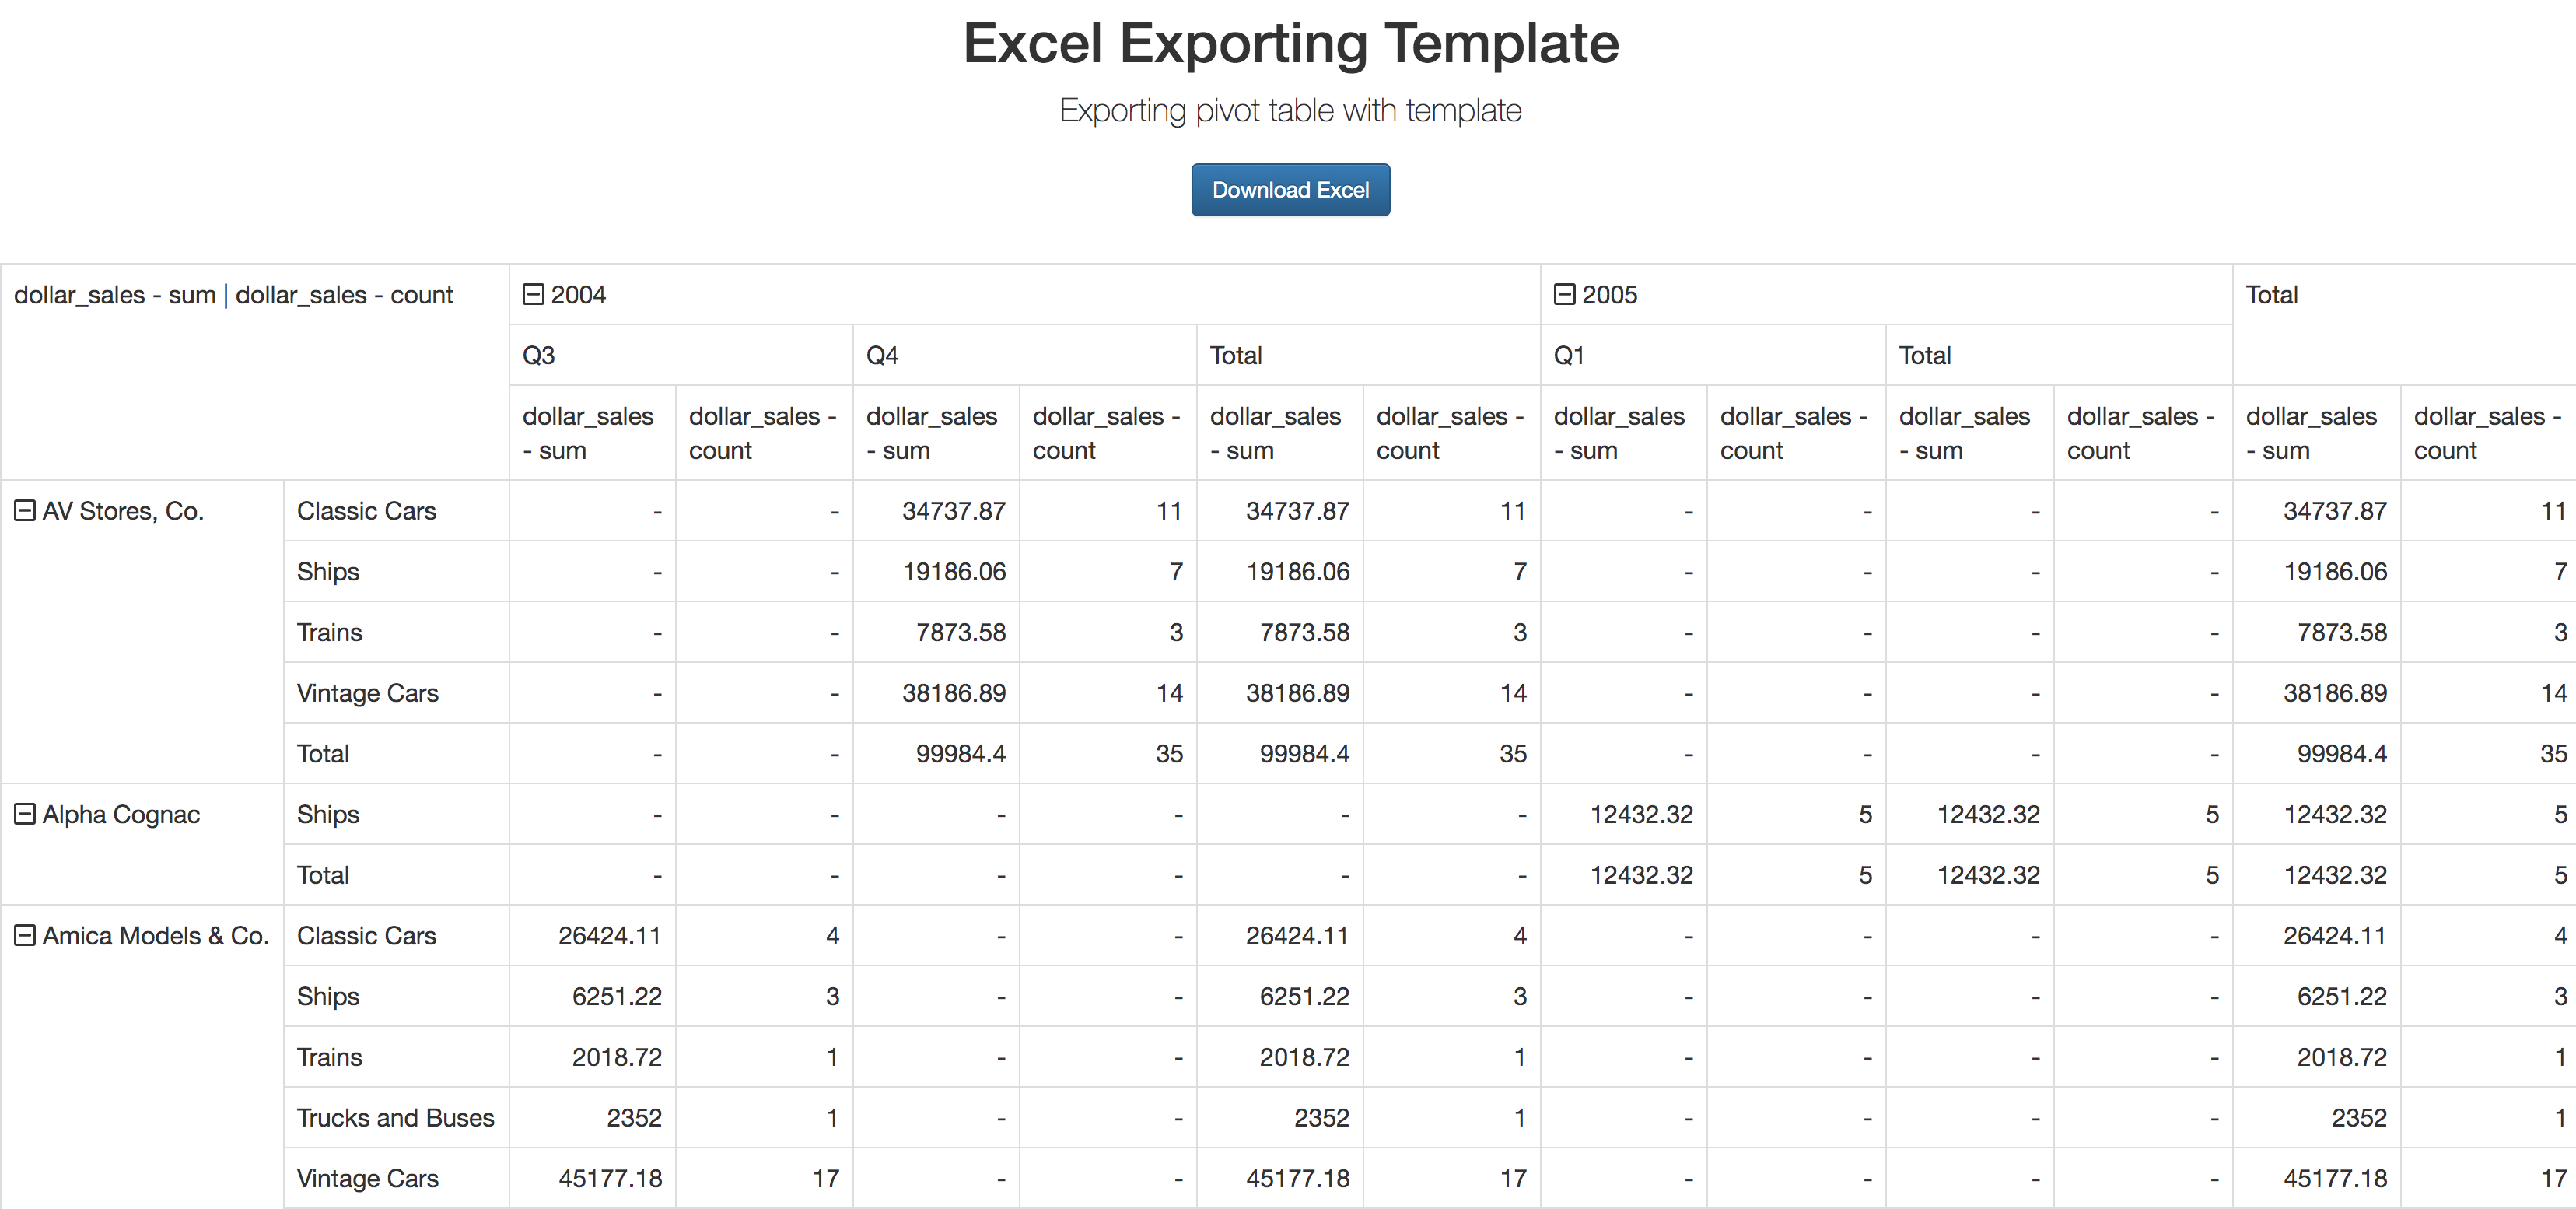
        <h1>Excel Exporting Template</h1>
        <p class="lead">Exporting pivot table with template</p>
		<form>
			<button type="submit" class="btn btn-primary" formaction="export.php">Download Excel</button>
		</form>
	</div>
	<div class='box-container'>
		<div>
			<?php
			PivotTable::create(array(
				"dataSource" => $this->dataStore('salesPivot'),
				"showDataHeaders" => true,
			));
			?>
		</div>
	</div>
</div>

MyReportExcel.view.php

<?php
    use \koolreport\excel\Table;
    use \koolreport\excel\PivotTable;
    use \koolreport\excel\BarChart;
    use \koolreport\excel\LineChart;

    $sheet1 = "Sales by Customer";
?>
<meta charset="UTF-8">
<meta name="description" content="Free Web tutorials">
<meta name="keywords" content="Excel,HTML,CSS,XML,JavaScript">
<meta name="creator" content="John Doe">
<meta name="subject" content="subject1">
<meta name="title" content="title1">
<meta name="category" content="category1">

<div sheet-name="<?php echo $sheet1; ?>">
    <?php
    $allStylesArray = [
        'font' => [
            'name' => 'Calibri', //'Verdana', 'Arial'
            'size' => 30,
            'bold' => false,
            'italic' => FALSE,
            'underline' => 'none', //'double', 'doubleAccounting', 'single', 'singleAccounting'
            'strikethrough' => FALSE,
            'superscript' => false,
            'subscript' => false,
            'color' => [
                'rgb' => '000000',
                'argb' => 'FF000000',
            ]
        ],
        'alignment' => [
            'horizontal' => 'general',//left, right, center, centerContinuous, justify, fill, distributed
            'vertical' => 'bottom',//top, center, justify, distributed
            'textRotation' => 0,
            'wrapText' => false,
            'shrinkToFit' => false,
            'indent' => 0,
            'readOrder' => 0,
        ],
        'borders' => [
            'top' => [
                'borderStyle' => 'none', //dashDot, dashDotDot, dashed, dotted, double, hair, medium, mediumDashDot, mediumDashDotDot, mediumDashed, slantDashDot, thick, thin
                'color' => [
                    'rgb' => '808080',
                    'argb' => 'FF808080',
                ]
            ],
            //left, right, bottom, diagonal, allBorders, outline, inside, vertical, horizontal
        ],
        'fill' => [
            'fillType' => 'none', //'solid', 'linear', 'path', 'darkDown', 'darkGray', 'darkGrid', 'darkHorizontal', 'darkTrellis', 'darkUp', 'darkVertical', 'gray0625', 'gray125', 'lightDown', 'lightGray', 'lightGrid', 'lightHorizontal', 'lightTrellis', 'lightUp', 'lightVertical', 'mediumGray'
            'rotation' => 90,
            'color' => [
                'rgb' => 'A0A0A0',
                'argb' => 'FFA0A0A0',
            ],
            'startColor' => [
                'rgb' => 'A0A0A0',
                'argb' => 'FFA0A0A0',
            ],
            'endColor' => [
                'argb' => 'FFFFFF',
                'argb' => 'FFFFFFFF',
            ],
        ],
    ];
    $styleArray = [
        'font' => [
            'italic' => true,
            'color' => [
                'rgb' => '808080',
            ]
        ],
    ];
    ?>
    <div>Sales PivotTable</div>
    <div>
        <?php
        PivotTable::create(array(
            "dataSource" => 'salesPivot',
            'hideSubTotalRows' => true,
            'hideSubTotalColumns' => true,
            'hideGrandTotalRow' => true,
            'hideGrandTotalColumn' => true,
            "showDataHeaders" => true,
            'map' => array(
                'rowField' => function($rowField, $fieldInfo) {
                    return $rowField;
                },
                'columnField' => function($colField, $fieldInfo) {
                    return $colField;
                },
                'dataField' => function($dataField, $fieldInfo) {
                    // Util::prettyPrint($fieldInfo);
                    $v = $dataField;
                    if ($v === 'dollar_sales - sum')
                        $v = 'Sales (in USD)';
                    else if ($v === 'dollar_sales - count')
                        $v = 'Number of Sales';
                    return $v;
                },
                'dataHeader' => function($dataField, $fieldInfo) {
                    // Util::prettyPrint($fieldInfo);
                    $v = $dataField;
                    if ($v === 'dollar_sales - sum')
                        $v = 'Sales (in USD)';
                    else if ($v === 'dollar_sales - count')
                        $v = 'Number of Sales';
                    return $v;
                },
                'waitingField' => function($waitingField, $fieldInfo) {
                    return $waitingField;
                },
                'rowHeader' => function($rowHeader, $headerInfo) {
                    // Util::prettyPrint($headerInfo);
                    $v = $rowHeader;
                    if (isset($headerInfo['childOrder']))
                        $v = $headerInfo['childOrder'] . ". " . $v;
                    return $v;
                },
                'columnHeader' => function($colHeader, $headerInfo) {
                    $v = $colHeader;
                    if ($headerInfo['fieldName'] === 'orderYear')
                        $v = 'Year-' . $v;
                    else if ($headerInfo['fieldName'] === 'orderQuarter')
                        $v = 'Quarter-' . $v;
        
                    if (isset($headerInfo['childOrder']))
                        $v = $headerInfo['childOrder'] . ". " . $v;
                    return $v;
                },
                'dataCell' => function($value, $cellInfo) {
                    return $value;
                    // Util::prettyPrint($cellInfo);
                    $rfOrder = $cellInfo['row']['fieldOrder'];
                    $cfOrder = $cellInfo['column']['fieldOrder'];
                    $df = $cellInfo['fieldName'];
                    $dfOrder = $cellInfo['fieldOrder'];
                    // return "$rfOrder:$cfOrder:$df. $value";
                    return $cellInfo['formattedValue'];
                },
            ),
            'excelStyle' => array(
                'dataField' => function($dataFields) use ($styleArray) {
                    return $styleArray;
                },
                'dataHeader' => function($dataFields, $fieldInfo) use ($styleArray) {
                    return $styleArray;
                },
                'columnHeader' => function($header, $headerInfo) use ($styleArray) {
                    return $styleArray;
                },
                'rowHeader' => function($header, $headerInfo) use ($styleArray) {
                    return $styleArray;
                },
                'dataCell' => function($value, $cellInfo) use ($styleArray) {                    
                    return $styleArray;
                },
            )
        ));
        ?>
    </div>
    
</div>

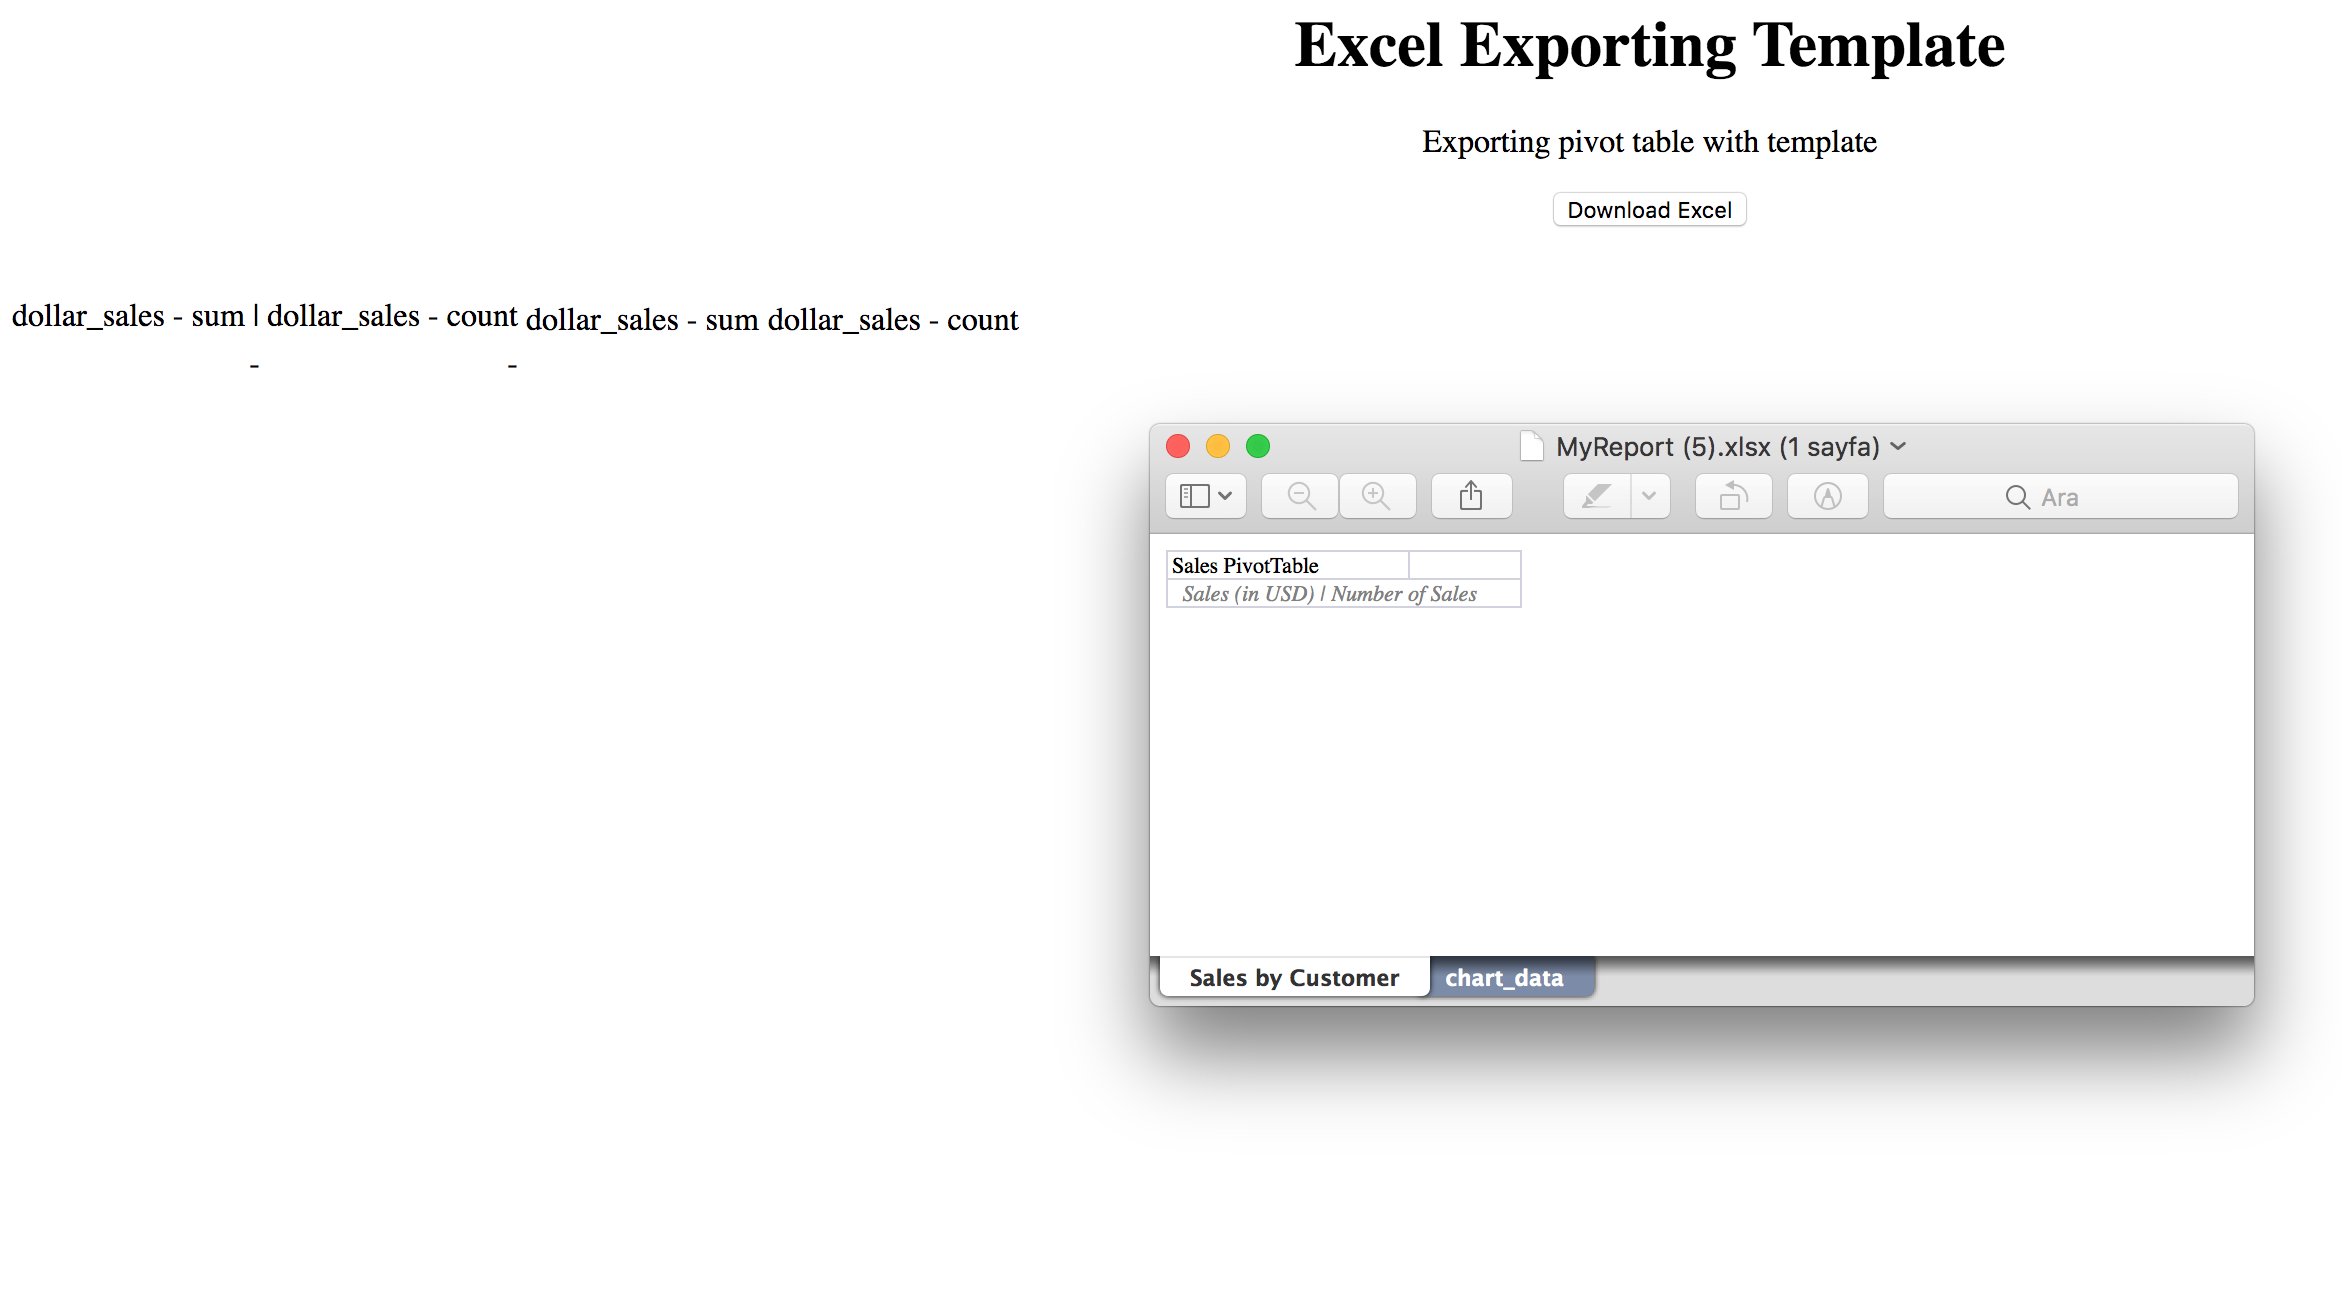
I get blank page like this

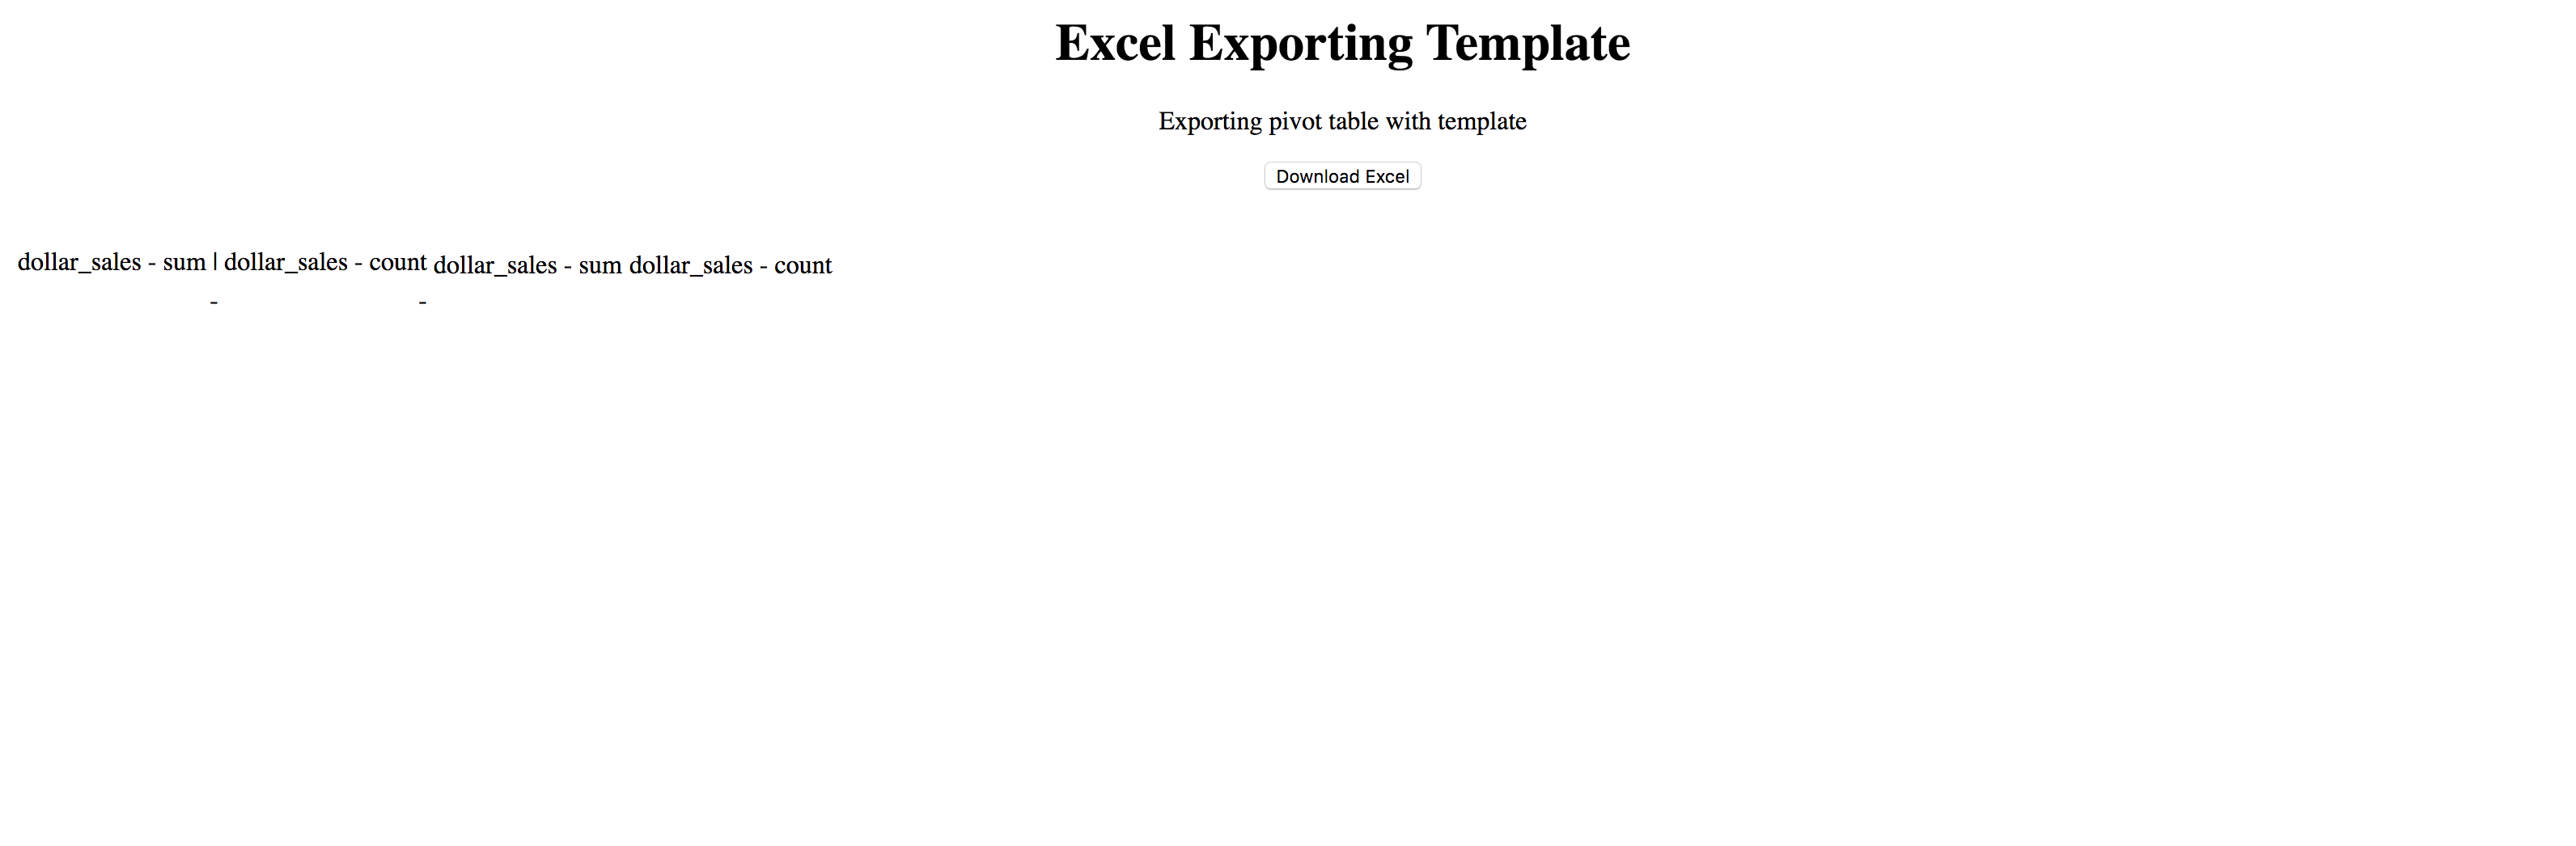
How can I solve this? thanks.

K
KoolReport commented on Mar 6, 2020

May I see the your code of initiating the excel exporting.

E
emre commented on Mar 6, 2020

here is the export.php

<?php
include "MyReport.php";
$report = new MyReport;
$report->run();
$report->exportToExcel('MyReportExcel')->toBrowser("MyReport.xlsx");

I exactly copied your example code and edit autoload.php, csv file path on my project. What can I do to solve this?

K
KoolReport commented on Mar 6, 2020

Your view with the name MyReportExcell.view.php so it should be

$report->exportToExcel('MyReportExcell')->toBrowser("MyReport.xlsx");

you have double "l" at the end.

D
David Winterburn commented on Mar 6, 2020

...

E
emre commented on Mar 6, 2020

I don't have double l in my project I just made typo when write here.

I tried to make another table with my csv file it looks like this.

But when I try Pivot there is no data to show.

I also try tried this example , but there is no data also.

My index.php code

<?php

require_once "/Applications/MAMP/htdocs/ytKoolReport/vendor/autoload.php";
require_once "YearsMonthsCustomersCategories.php";

$YearsMonthsCustomersCategories = new YearsMonthsCustomersCategories;
$YearsMonthsCustomersCategories->run()->render();

My YearsMonthsCustomersCategories.php codes

<?php

use \koolreport\pivot\processes\Pivot;
use \koolreport\processes\Filter;
use \koolreport\processes\ColumnMeta;
use \koolreport\core\src\datasources\CSVDataSource;

class YearsMonthsCustomersCategories extends \koolreport\KoolReport
{
    //Settings
  
    function settings()
    {   
        return array(
            "dataSources" => array(
                "dollarsales"=>array(
                    'filePath' => '/Applications/MAMP/htdocs/ytKoolReport/YearsMonthsCustomersCategories/table.csv',
                    'fieldSeparator' => ',',
                    'class' => "\koolreport\datasources\CSVDataSource"      
                ), 
            )
        );        
    }

    //koolreport/core/src/processes/Filter
    //Setup
    function setup()
    {
        $node = $this->src('dollarsales');
        $node->pipe(new Filter(array(
            array('customerName', '<', 'Am'),
            array('orderYear', '>', 2003)
        )))
        ->pipe(new ColumnMeta(array(
            "dollar_sales"=>array(
                'type' => 'number',
                "prefix" => "$",
            ),
        )))
        ->pipe(new Pivot(array(
            "dimensions"=>array(
                "column"=>"orderYear, orderMonth",
                "row"=>"customerName, productLine"
            ),
            "aggregates"=>array(
                "sum"=>"dollar_sales",
                "count"=>"dollar_sales"
            )
        )))
        ->pipe($this->dataStore('sales'));  

    }

}

And my YearsMonthsCategories.view.php codes

<?php

use \koolreport\pivot\widgets\PivotTable;
?>

<!DOCTYPE html>
<html>
<head>
    <title>Top10</title>
</head>
<body>


 <?php
          $dataStore = $this->dataStore('sales');
          PivotTable::create(array(
            "dataStore"=>$dataStore,
            "rowDimension"=>"row",
            "columnDimension"=>"column",
            "measures"=>array(
              "dollar_sales - sum", 
              // 'dollar_sales - count',
            ),
            'rowSort' => array(
              'dollar_sales - count' => 'desc',
            ),
            'columnSort' => array(
              'orderMonth' => function($a, $b) {
                return (int)$a < (int)$b;
              },
            ),
            'rowCollapseLevels' => array(0),
            'columnCollapseLevels' => array(0),
            'width' => '100%',
            'nameMap' => array(
              'dollar_sales - sum' => 'Sales (in USD)',
              'dollar_sales - count' => 'Number of Sales',
              '1' => 'January',
              '2' => 'February',
              '3' => 'March',
              '4' => 'April',
              '5' => 'May',
              '6' => 'June',
              '7' => 'July',
              '8' => 'August',
              '9' => 'September',
              '10' => 'October',
              '11' => 'November',
              '12' => 'December',
            ),
          ));
        ?>
</body>

</html>

Result of this codes like this:

D
David Winterburn commented on Mar 6, 2020

Hi,

What happens if you use our csv file like in the original pivot example?

E
emre commented on Mar 6, 2020

Hi David when I change name of csv file, nothing happens. If you are talking about file path when I change it to this

function settings()
    {
        return array(
            "dataSources" => array(
                "dollarsales"=>array(
                    'filePath' => '../../../databases/customer_product_dollarsales2.csv',
                    'fieldSeparator' => ',',
                    'class' => "\koolreport\datasources\CSVDataSource"      
                ), 
            )
        );

The error is :

Warning: fopen(../../../databases/customer_product_dollarsales2.csv): failed to open stream: No such file or directory in /Applications/MAMP/htdocs/ytKoolReport/vendor/koolreport/core/src/datasources/CSVDataSource.php on line 131

There is no databases path on my project.

E
emre commented on Mar 6, 2020

I tried another example, It is "Sales By Country" map. It works. Only pivot is not working.

Pivot export example s

D
David Winterburn commented on Mar 6, 2020

Can you find the file "customer_product_dollarsales2.csv" in the example package you downloaded? Then put the file right in the pivot example and set "filePath" => "customer_product_dollarsales2.csv".

E
emre commented on Mar 6, 2020

Hey David, thanks for the help now it works. My csv seperated with "," but csv inside examples folder separated with ";" now I can see content of CSV.

Thank you so much!

Build Your Excellent Data Report

Let KoolReport help you to make great reports. It's free & open-source released under MIT license.

Download KoolReport View demo
help needed
solved

Pivot