Hi,
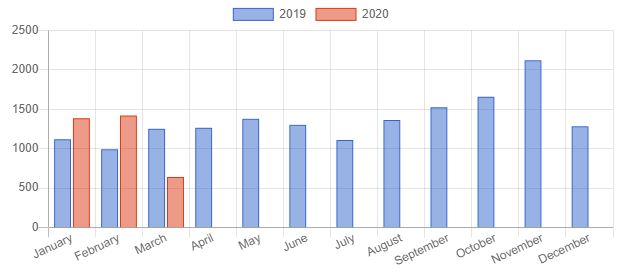
I was wondering if there is a neat way to show sales by month in the columnchart while showing yearly comparison.
so my sql would get the data like this :
SELECT YEAR,Month,Sale FROM sales GROUP BY YEAR,Month ORDER BY YEAR,Month;
say the output is sales for the years 2019 and 2020 by month, the columnchart would show sales for all the months for 2019 and then till march for 2020 in the same chart.
