KoolReport's Forum

Official Support Area, Q&As, Discussions, Suggestions and Bug reports.
Forum's Guidelines

Google chart data label for line chart inside combo #1876

Closed ankit raj opened this topic on on Jan 28, 2021 - 2 comments

ankit raj commented on Jan 28, 2021

Hi i am using google combo chart with a column and a line combo as shown in the figure:
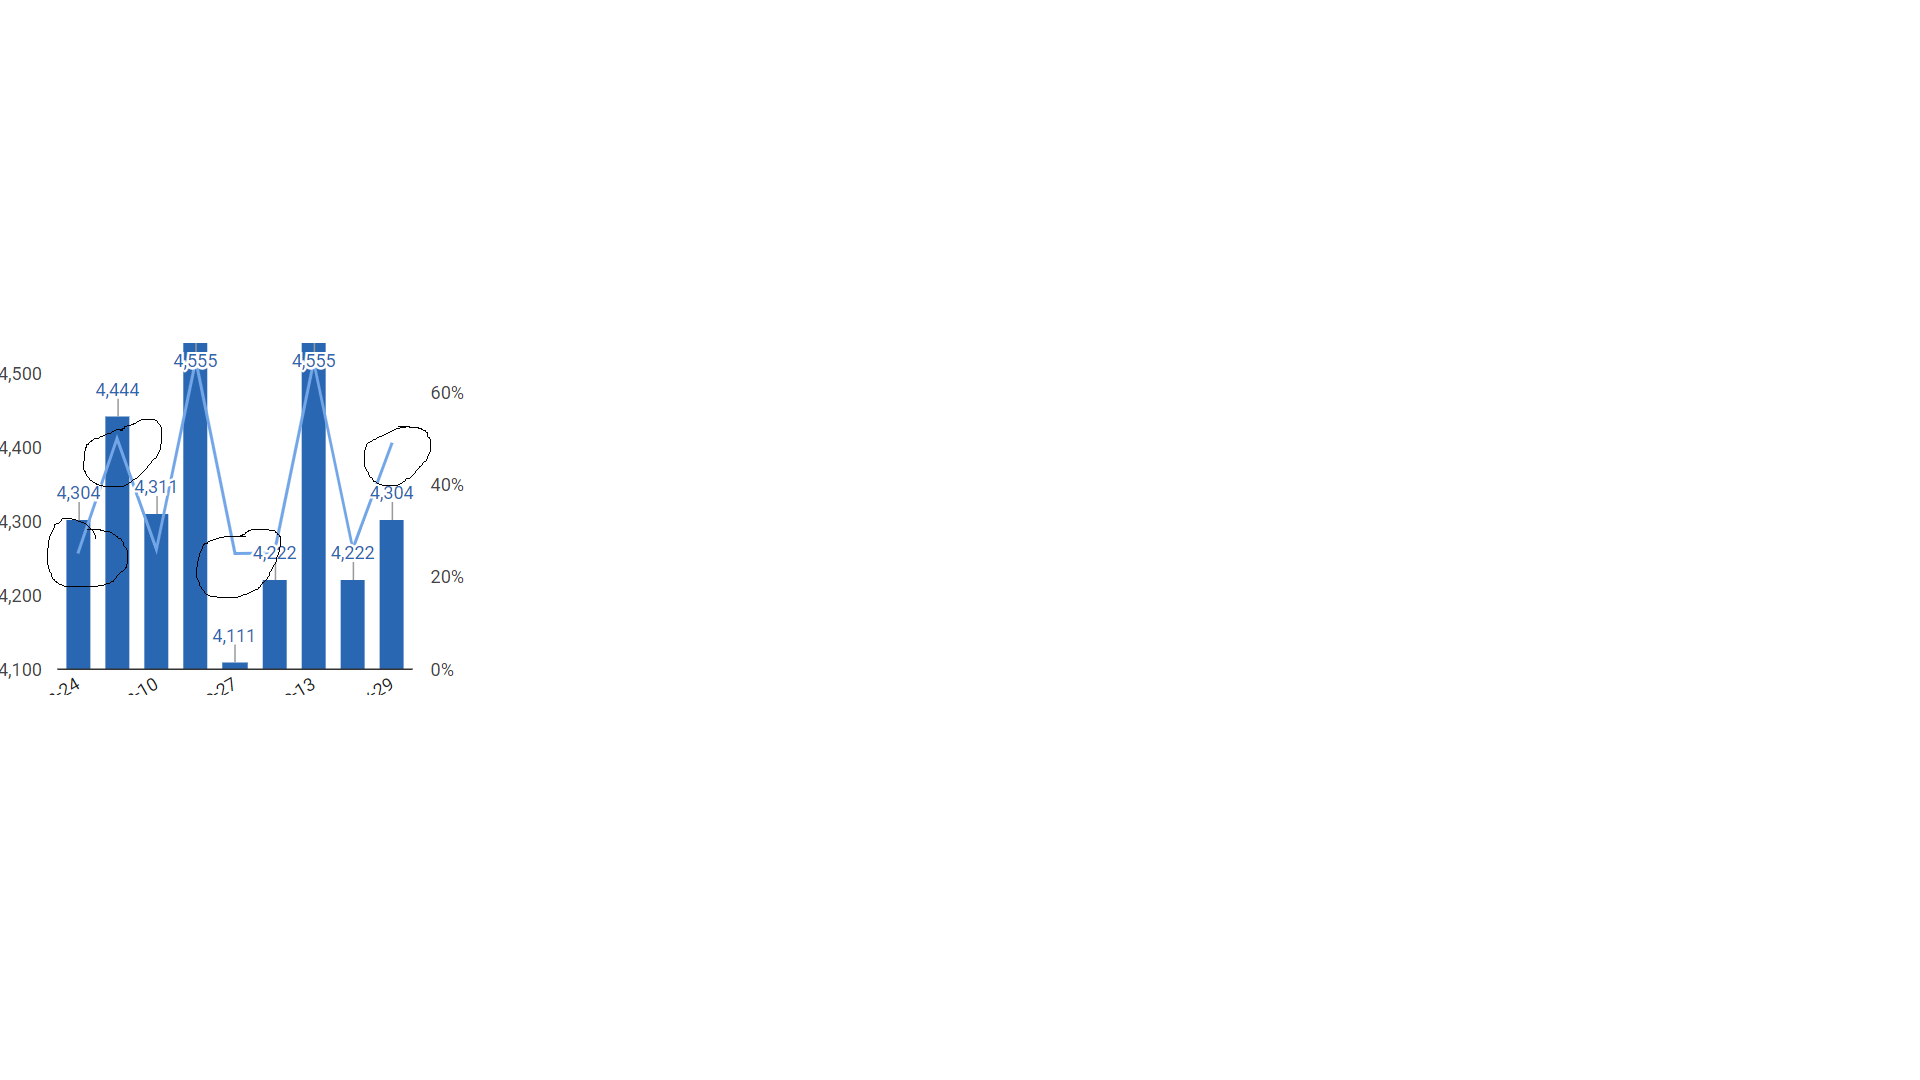
I am getting the data values for the column chart , but i also want the data values in the graph itself for line chart also since there will be very less values and i don't want the user to hover and check the line chart value. What should i do? Here is my snippet:

\koolreport\widgets\google\ComboChart::create(array(
            "title"=>$title,
            "dataSource"=>$data,
            "colorScheme"=>$color_scheme,
            "columns"=>array(
                "category",
                "value"=>array(
                    "label"=>$text_label[$opt]['first'],
                    "type"=>"number",
//                    "style"=>function($row){
//                        return "color:#ADBD37;fill-opactity:0.6";
//                    },
                    "annotation"=>function($row)
                    {
                        return number_format($row["value"]);
                    }

                ),

                "avg"=>array(
                    "label"=>$text_label[$opt]['second'],
                    "type"=>"number",
                    "chartType"=>"line",

                ),
            ),
            "options"=>array(
                "series"=> array(
                    0=> array("targetAxisIndex"=> 0),
                    1=> array("targetAxisIndex"=> 1),
                ),
                "vAxes"=>array(
                    0=> array("title"=> $text_label[$opt]['first'],"gridlines"=>["color"=>"none"]),
                    1=> array("title"=> $text_label[$opt]['second'],"gridlines"=>["color"=>"none"],"format"=> $text_second_axis)
                ),
                "responsive"=>true,
                "maintainAspectRatio"=> false,
                "legend"=>array(
                    "position"=>'bottom'
                ),
            ),
        ));
KoolReport commented on Jan 29, 2021

You add the "anotation" property to the "avg" column, have you tried this?

ankit raj commented on Jan 29, 2021

Thanks , annotations in avg column was missing.

Build Your Excellent Data Report

Let KoolReport help you to make great reports. It's free & open-source released under MIT license.

Download KoolReport View demo
None yet

None