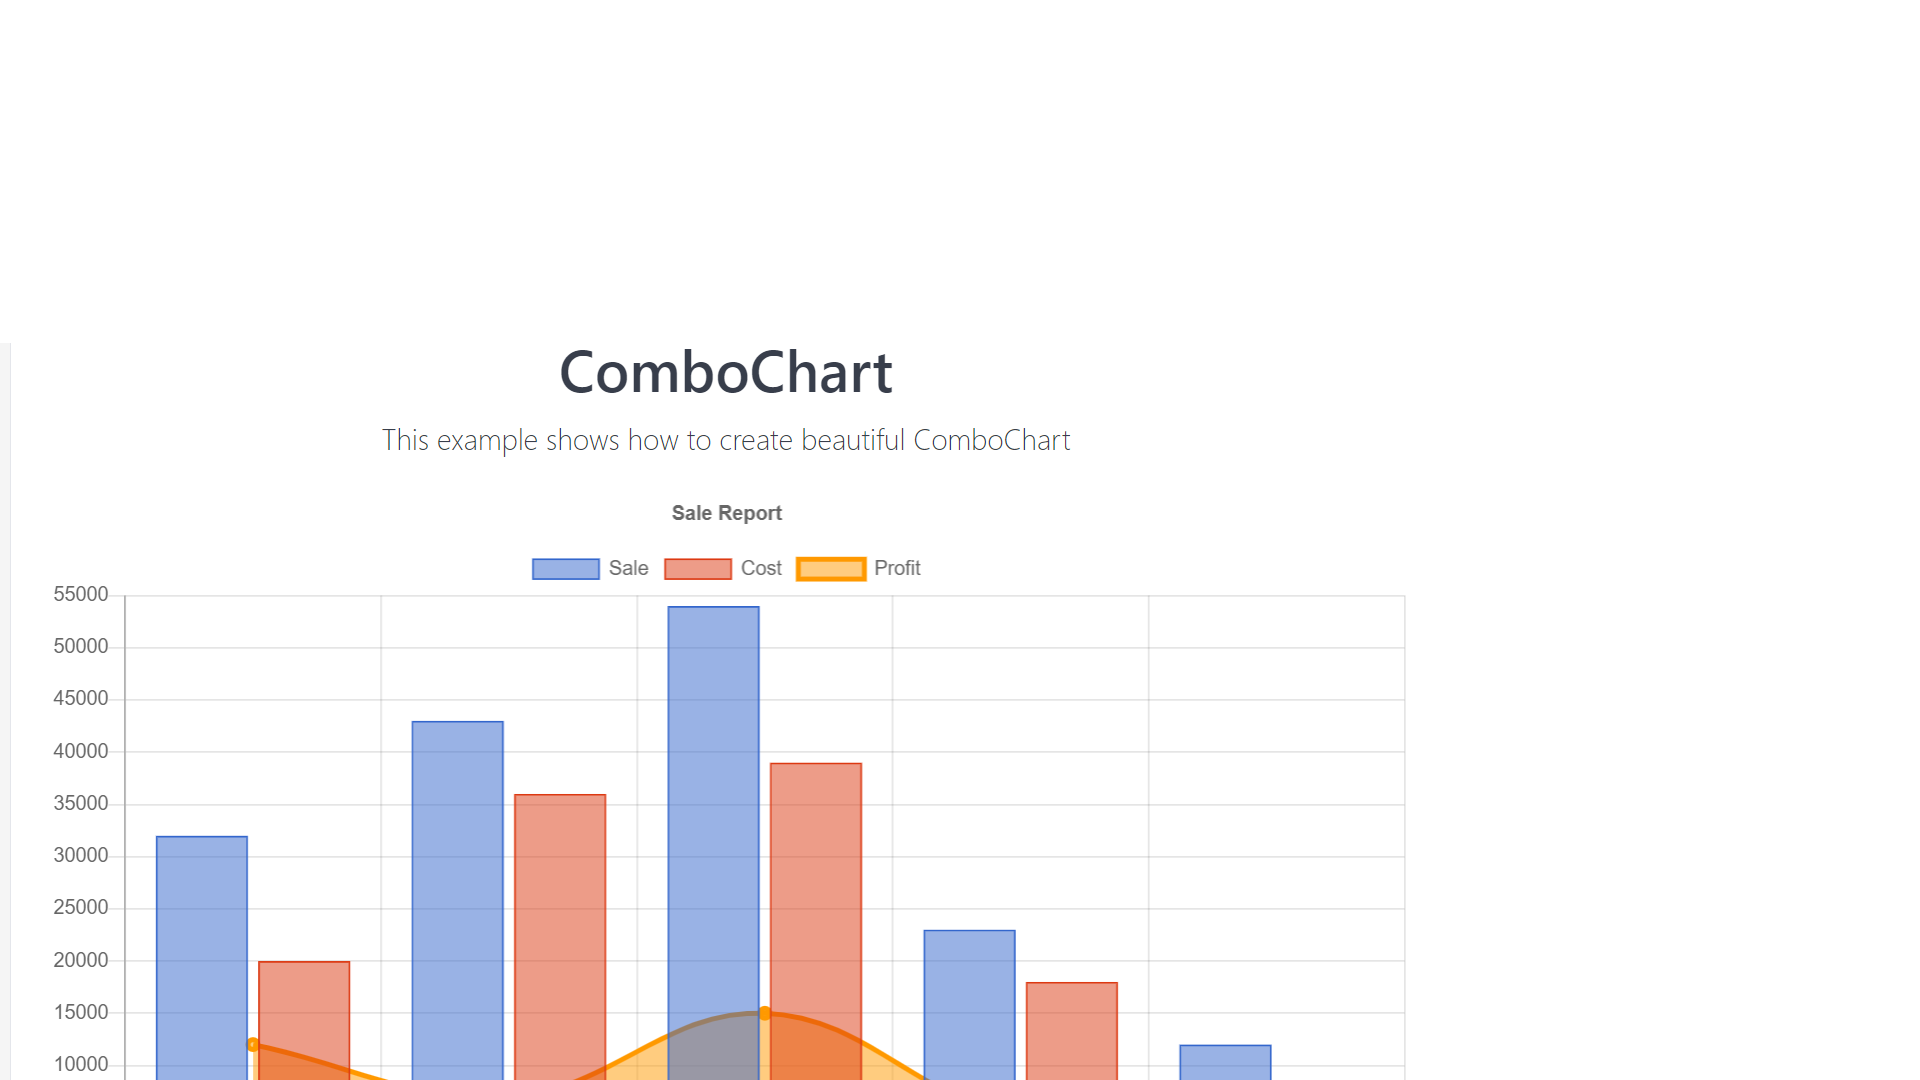
Hi , I was using the example mentioned in the website to create a combo chart with bar and line chart , but even in example , although the property is passed as line :
 "config"=>array(
            "type"=>"line",//Line chart is draw
            "borderWidth"=>3,
        )
It is drawing an area chart as seen in the image:

How can i make it line instead of area chart?