Dear support team,
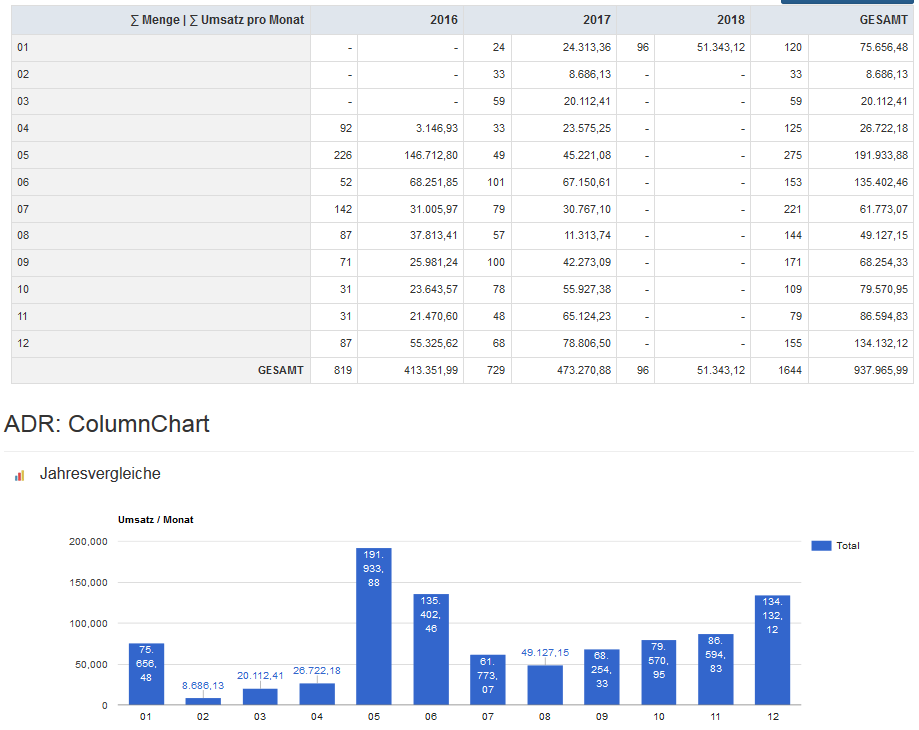
with my following setup I get a result via cube piping (dataStore('ADR.FIRMENCHART')) a google chart where the TOTAL values (database field "Wert") are shown for each "Month" (see the first screenshot below).
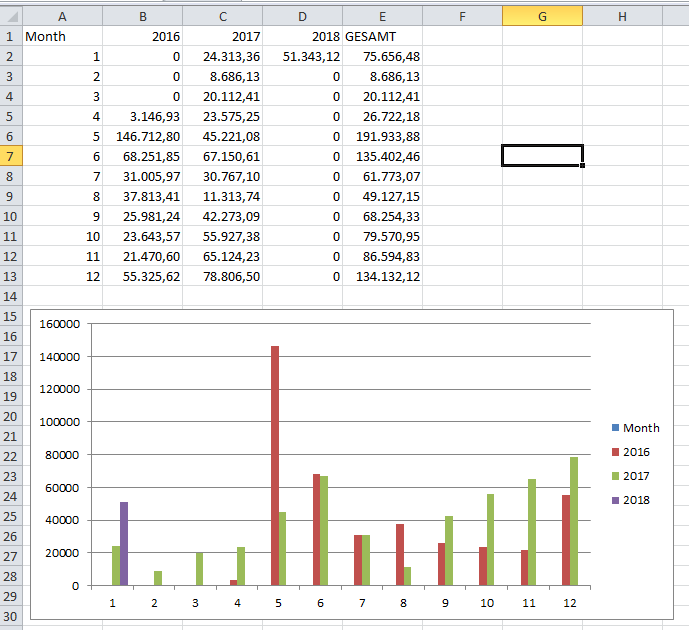
But what i would like to generate a GoogleChart for each "Year" the "Wert" value with corresponding "Month" (see the secon screenshot from Excel).
		// FIRMENDETAIL-PIVOT: Umsatz/Menge aggregieren
		if(count($this->params["Auftrg"])>0){$whereAuftrg="Auftrg IN (:Auftrg) ";}else{$whereAuftrg="Auftrg IS NOT NULL ";}

		//$node = $this->src('adr')
		$this->src('adr')
			->query("
			SELECT Auftrg, NameWarenem, NameAuftr, StrasAuftr, PlzAuftr, OrtAuftr, Produktname, FakdatZBCP, Ag2, AG1Beschreibung, AG2Beschreibung, AuftrM, Wert
			FROM Reporting.TOTAL_v

			WHERE
				$whereAuftrg

		")->params(array(
			":Auftrg"=>$this->params["Auftrg"],
		))

		->pipe(new Custom(function($data){
			$data["Wert"] = trim(str_replace(",",".",$data["Wert"]));
			return $data;
		}))

		->pipe(new ColumnMeta(array(
            "Wert"=>array(
				"align"=>"right",
                "type"=>"number",
                "prefix"=>"",
				"suffix"=>"",
				"decimals"=>2,
				"thousandSeparator"=>".",
				"decimalPoint"=>",",
            )
		)))

		->pipe(new Map(array(
			  '{value}' => function($row, $metaData) {
				$date = explode('.', $row['FakdatZBCP']);
				$row['Year'] = $date[0];
				$row['Month'] = $date[1];
				return array($row);
			  },
			  '{meta}' => function($metaData) {
				$metaData['columns']['Year'] = array(
				  'type' => 'number',
				);
				$metaData['columns']['Month'] = array(
				  'type' => 'number',
				);
				return $metaData;
			  }
			)))

		->saveTo($node);

		$node->pipe(new Pivot(array(
				"dimensions"=>array(
					"column" => "Year",
					"row" => "Month",
				),
				"aggregates" => array(
					"sum" => "AuftrM, Wert",
				)
			)))
		->pipe($this->dataStore('ADR.FIRMENDETAIL'));


		$node->pipe(new Limit(array(1)))
		->pipe($this->dataStore('Reporting.FIRMENMETADATEN'));

        $node->pipe(new Cube(array(
            "row"=>"Month",
            "sum"=>"Wert",
        )))
		->pipe(new ColumnMeta(array(
			"{{all}}"=>array(
				"label"=>"Total",
			)
		)))
        ->pipe(new Sort(array(
            "Month"=>"asc"
        )))
		->pipe($this->dataStore('ADR.FIRMENCHART'));
My view.php:
		<?php
			google\ColumnChart::create(array(
				"dataStore"=>$this->dataStore('ADR.FIRMENCHART'),

				"columns"=>array(
					"Month",
					"{{all}}"=>array(
						"type"=>"number",
						"prefix"=>"",
						"suffix"=>"",
						"decimals"=>2,
						"thousandSeparator"=>".",
						"decimalPoint"=>",",
						"annotation"=>function($row)
						{
							//return "$".number_format($row["{{all}}"]);
							return number_format($row["{{all}}"],2,',','.');
						},
					)
				),

				"options"=>array(
					"title"=>"Umsatz / Monat",
					"animation"=>array(
						"startup"=>true,
						"duration"=>2000,
						"easing"=>'out',
					),
					"isStacked"=>true,
					"orientation"=>"horizontal", //vertical
				),
				"width"=>"100%",
			));
		?>
Screenshot1 (how it's now with the code above):

Screenshot 2 (how it should be):

Any idea how to do this?
Kind regards,