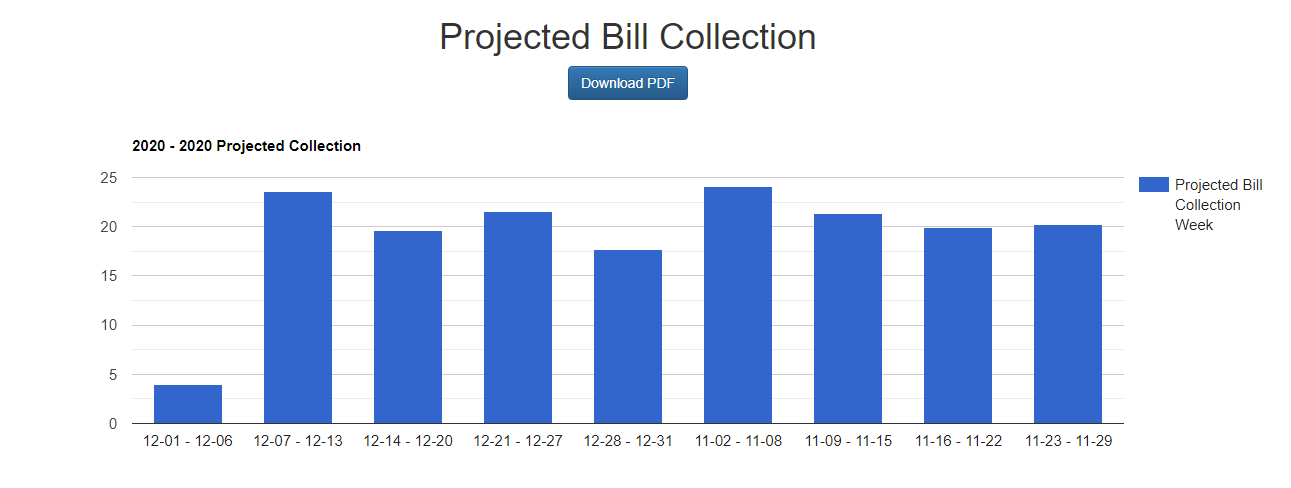
Our Chartjs package has supported multi color in one series yet. There're two work around solutions for you in this case:
1 . Make your data multiple series (i.e one row with multiple columns instead of multiple rows with one column). You could try our Transpose or Transpose2 process to transpose the data.
2 . Edit the file koolreport/BarChart.php and replace the following lines:
            $dataset = array(
                "label"=> Utility::get($cSettings,"label",$columnKeys[$i]),
                "borderWidth"=>1,
                "borderColor"=>$this->getColor($i-1),
                "backgroundColor"=>$this->getRgba($this->getColor($i-1),$this->backgroundOpacity),
                "data"=>array(),
                "fdata"=>array(),
            );
with these ones:
            $dataset = array(
                "label"=> Utility::get($cSettings,"label",$columnKeys[$i]),
                "borderWidth"=>1,
                "borderColor"=>$this->getColor($i-1),
                "backgroundColor"=>$this->getRgba($this->getColor($i-1),$this->backgroundOpacity),
                "data"=>array(),
                "fdata"=>array(),
            );
            $backgroundColorArray = Utility::get($this->params, "backgroundColorArray");
            if (isset($backgroundColorArray)) $dataset["backgroundColor"] = $backgroundColorArray;
Then in your BarChart's create in your report's view:
            ColumnChart::create(array(
                ...
                "backgroundColorArray" => ["#FF0000","#00FF00","#0000FF","#FF0000","#00FF00","#0000FF","#FF0000","#00FF00","#0000FF",] //use color hexa code
            ));
Rgds,
