KoolReport's Forum
Official Support Area, Q&As, Discussions, Suggestions and Bug reports.
Forum's Guidelines
Add some drawing to the waterfall chart #2242
Well, this would require another modification of the waterfall's code because it hasn't had this option yet. Pls open the file koolreport/D3/clients/waterfall/waterfall.js and replace the following line:
}; // drawWaterfall
with these ones:
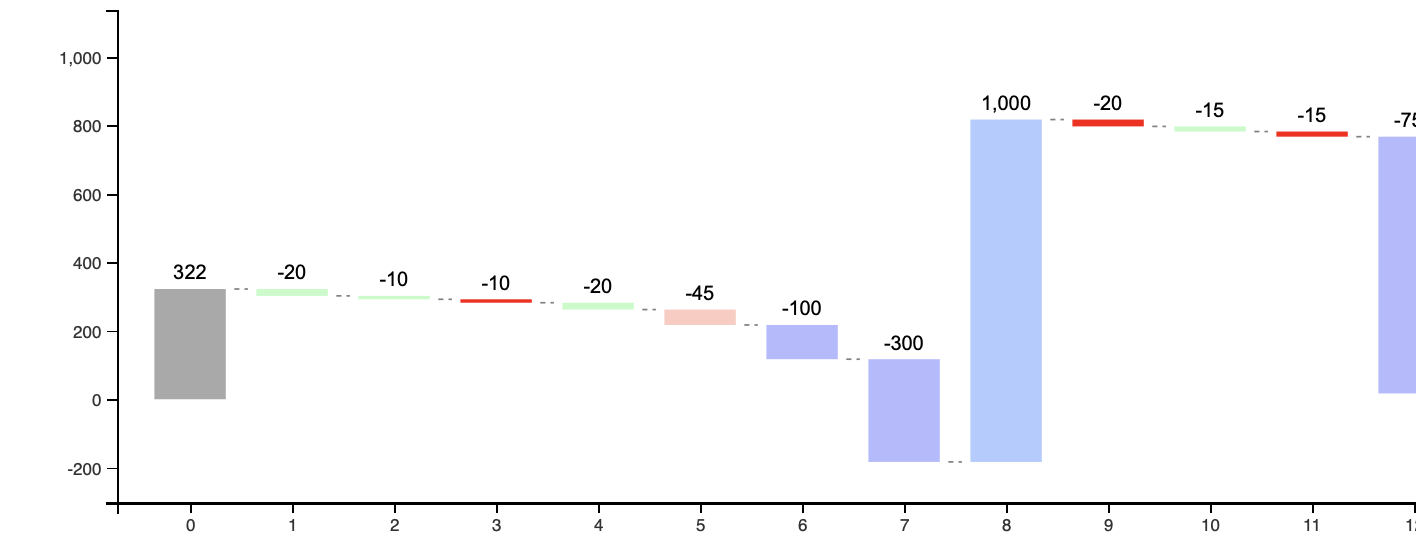
            // add a no label x axis at y value
            var xAxisYValue = 0; // change this value to what you want, here you request it at 0
            var yAxisMax = max + (max - min) * 0.1;
            var yTranslate = height * (yAxisMax - xAxisYValue) / (yAxisMax - min) ;
            // console.log(max, min, height, yTranslate);
            const xNolabel = d3
                .scaleBand()
                .rangeRound([0, width])
                .padding(padding);
            const xAxisNoLabel = d3.axisBottom(xNolabel);
            chart
                .append('g')
                .attr('class', 'x axis')
                .attr('transform', `translate(0,${yTranslate})`)
                .call(xAxisNoLabel);

        }; // drawWaterfall
Certainly you could add this as an option for the Waterfall php widget and only apply this addtional js code when the option is true. Rgds,
Pls output all these min, max values:
            console.log("max=", max, "  min=", min);
            var yAxisMax = max + (max - min) * 0.1;
            var yTranslate = height * (yAxisMax - xAxisYValue) / (yAxisMax - min) ;
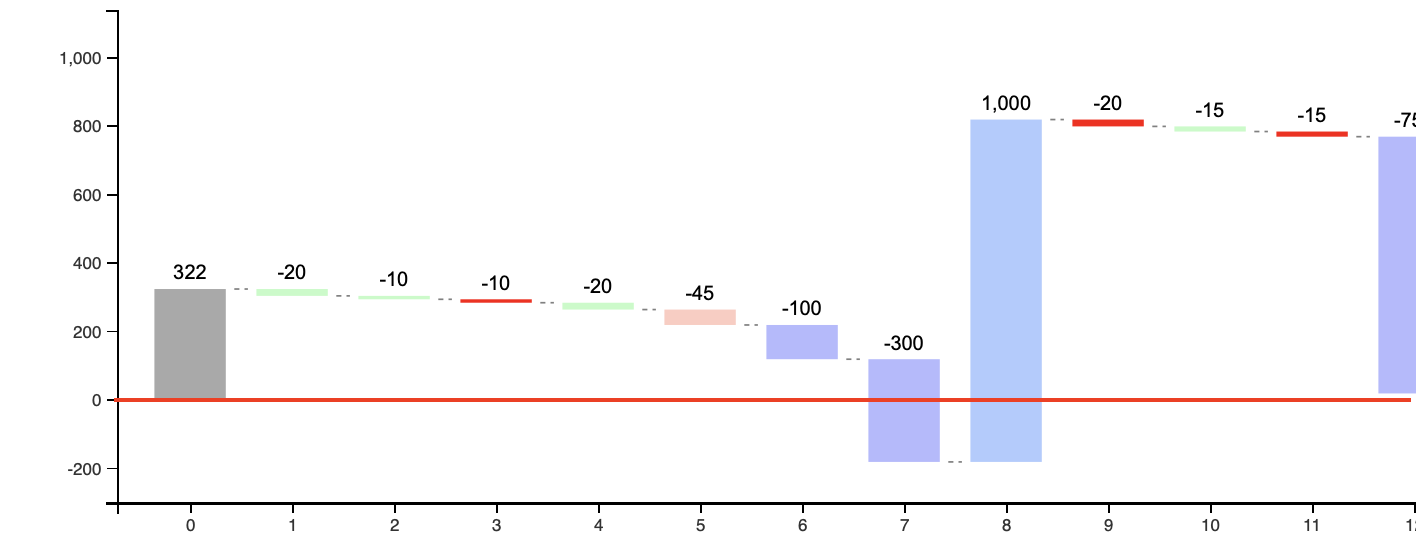
We want the max in your example to be 1000 while min around -300 (the y value of the main x axis). If the min, max values are not that your yTranslate value would not be where the yValue 0 is.
In any case, since you already made a lot of change to this waterfall chart I can not be sure which formula yTranslate should be. Just experiment with the yTranslate formula till you get the additional x axis to yValue 0.
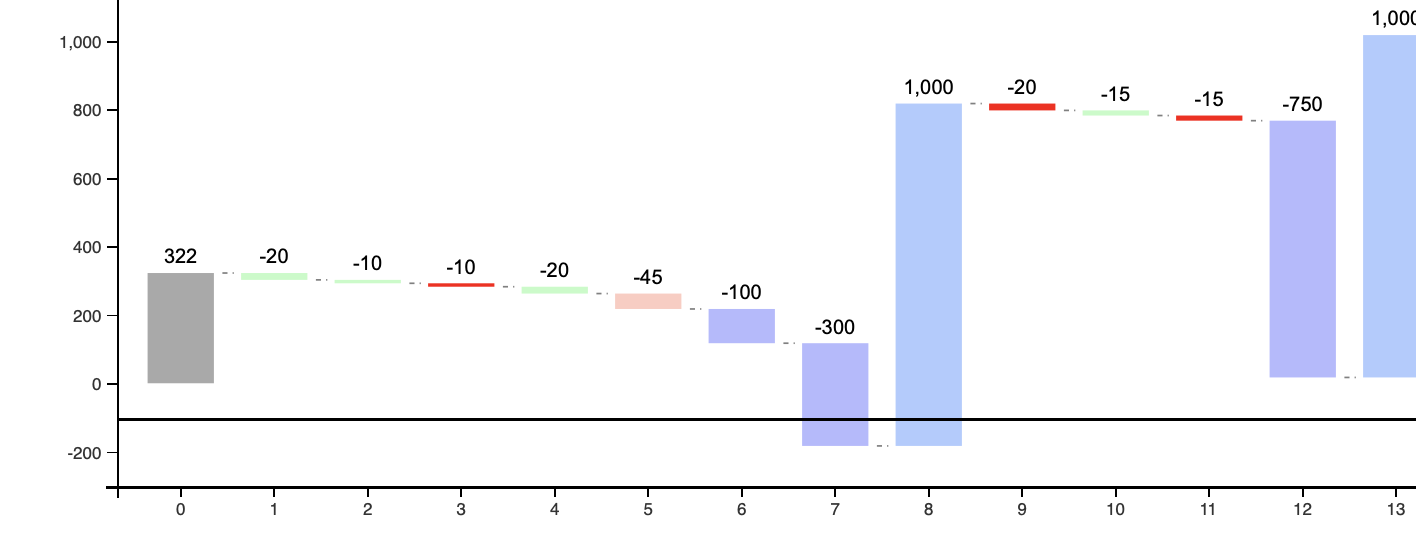
Ok, I think when min is less than 0 we have a different real min axis value. Pls replace the following lines:
            // add a no label x axis at y value
            var xAxisYValue = 0; // change this value to what you want, here you request it at 0
            var yAxisMax = max + (max - min) * 0.1;
            var yTranslate = height * (yAxisMax - xAxisYValue) / (yAxisMax - min) ;
            ...
with these ones:
            // add a no label x axis at y value
            var xAxisYValue = 0; // change this value to what you want
            var extra = (max - min) * 0.1;
            var yAxisMax = max + extra;
            var yAxisMin = min < 0 ? min - extra : min;
            var yTranslate = height * (yAxisMax - xAxisYValue) / (yAxisMax - yAxisMin);
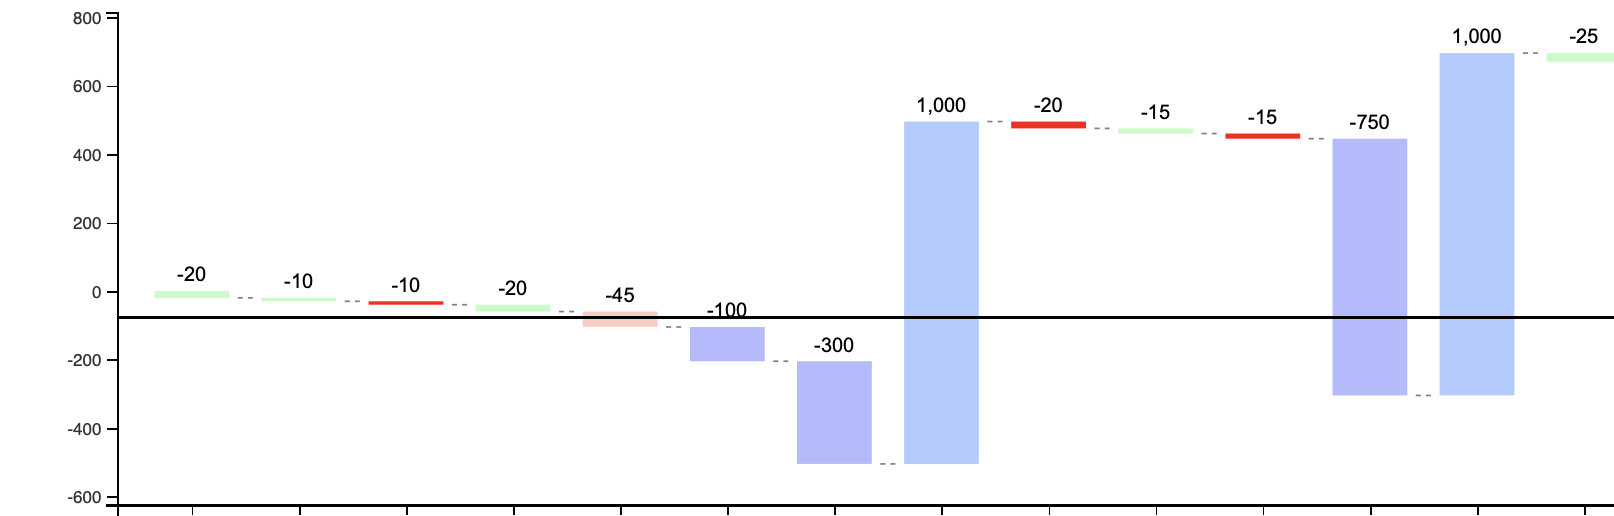
Let us know how it works for you. Tks,
Build Your Excellent Data Report
Let KoolReport help you to make great reports. It's free & open-source released under MIT license.
Download KoolReport View demo