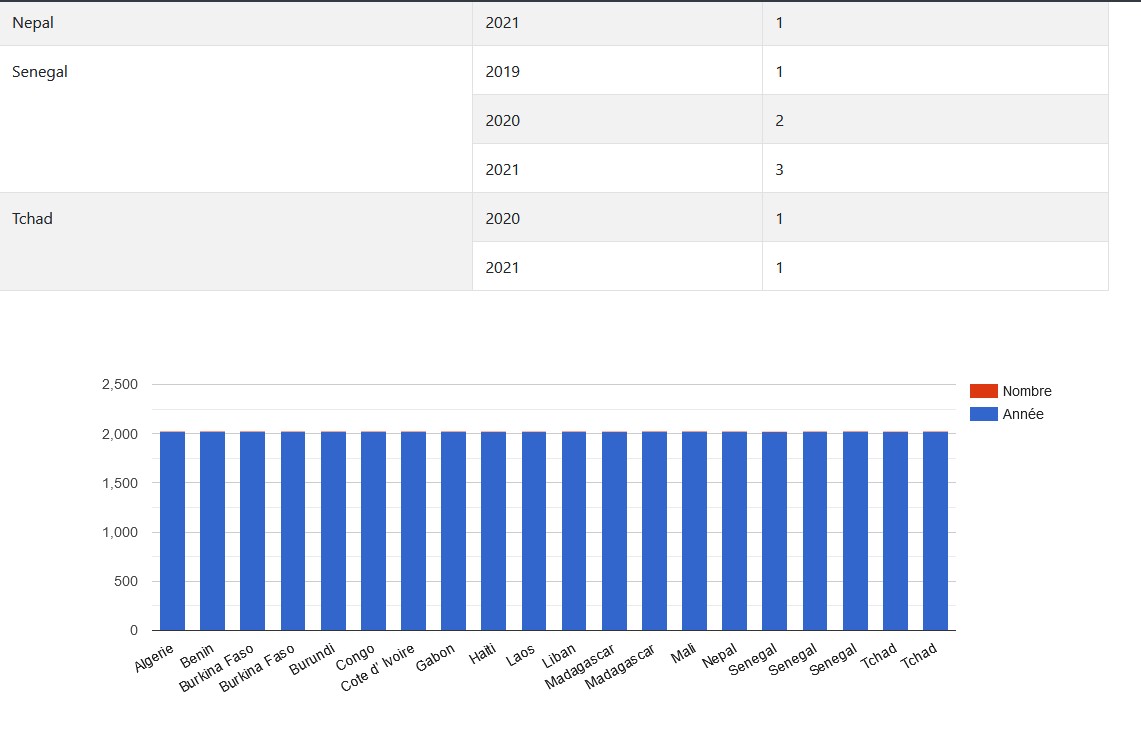
Hello, from a SQL data table, I query "pays", and 'date" I have them grouped by "pays" and "year" and number in groups. It's OK with table presentation, but I cannot obtain a column chart with pays on x axis, and stacked number of each year data.
Here are the files : ActionsParPaysetAnnee :
<?php

require_once "../../../load.koolreport.php";

use \koolreport\processes\Group;
use \koolreport\processes\Sort;
use \koolreport\processes\Limit;
use \koolreport\processes\Map;


class ActionsParPaysetAnnee extends \koolreport\KoolReport
{

  public function settings()
    {
        $config = include "../../../config.php";

        return array(
            "dataSources"=>array(
                "phamm"=>$config["phamm"]
            )
        );
    }


  function setup()
  {
       $this->src('phamm')
        ->query("
		SELECT
		count(expeditions.id) AS Nombre,
		year(expeditions.date_expedition) AS Annee,
		expeditions.pays AS Pays
		FROM
		expeditions
		WHERE
		expeditions.pays <> 'France'
		GROUP BY Pays, Annee
			")
   		->pipe(new \koolreport\processes\Map(array(
		"{meta}" => function($meta) {
			foreach ($meta["columns"] as $colName => $colMeta) {
            $meta["columns"][$colName]["thousandSeparator"] = "";
            $meta["columns"][$colName]["decimalPoint"] = "";
        }
        return $meta;
    }
)))
       ->pipe($this->dataStore('actionspaysannee'));
  }
}

__ActionsParPaysetAnnee.view__

<?php
    use \koolreport\widgets\koolphp\Table;
	use \koolreport\widgets\google\ColumnChart;

?>

<div class="report-content">
    <div class="text-center">
        <h1>Actions par pays</h1>
        <p class="lead">Evolution annuelle des actions par pays</p>
    </div>
  <?php
    Table::create(array(
        "dataStore"=>$this->dataStore('actionspaysannee'),
		"sorting"=>array(
			"Pays"=>"asc",
			"Annee"=>"asc",
			),
        "columns"=>array(
            "Pays"=>array(
                "label"=>"Pays"
            ),
			"Annee"=>array(
				"label"=>"Année"
			),
            "Nombre"=>array(
                "type"=>"number",
                "label"=>"Nombre",
            )
        ),
        "cssClass"=>array(
            "table"=>"table table-bordered table-striped"
        ),
		"removeDuplicate"=>array("Pays"),
    ));
    ?>
	   <div style="margin-bottom:50px;">
    <?php
        ColumnChart::create(array(
            "dataStore"=>$this->dataStore('actionspaysannee'),
		"columns"=>array(
			"Pays",
            "Annee"=>array(
                "label"=>"Année"
			),
            "Nombre"=>array(
                "type"=>"number",
                "label"=>"Nombre",
            )
        ),
        "options"=>array(
            "isStacked"=>true
        )
    ));
    ?>
    </div>
    <?php

    ?>


</div>
What is wrong with my data in chart ?
 .
.