KoolReport's Forum
Official Support Area, Q&As, Discussions, Suggestions and Bug reports.
Forum's Guidelines
Change color of line from a selected moment #2841
With Chartjs' LineChart, you could set the each line's color dynamically with its "borderColor" property like this:
    LineChart::create(array(
        "title"=>"Sale vs Cost",
        "dataSource"=>$time_sale,
        "columns"=>array(
            "month",
            "sale"=>array(
                "label"=>"Sale",
                "type"=>"number",
                "prefix"=>"$",
                "borderColor" => "function(context) { // use this javascript function to set sale line's line color
                    console.log(context);
                    var index = context.dataIndex;
                    var value = context.dataset.data[index];
                    console.log(index, value);
                    return ...; // return line color based on context
                }",
            ),
            "cost"=>array(
                "label"=>"Cost",
                "type"=>"number",
                "prefix"=>"$"
            ),
        )
    ));
Let us know if you have any issue. Tks,
If you want to change color of points instead of lines use "pointBorderColor" and "pointBackgroundColor" instead of "borderColor":
                "pointBorderColor" => "function(context) {
                    console.log(context);
                    var index = context.dataIndex;
                    var value = context.dataset.data[index];
                    console.log(index, value);
                    return ...; // return point border color based on context
                }",
                "pointBackgroundColor" => "function(context) {
                    console.log(context);
                    var index = context.dataIndex;
                    var value = context.dataset.data[index];
                    console.log(index, value);
                    return ...; // return point background color based on context
                }",
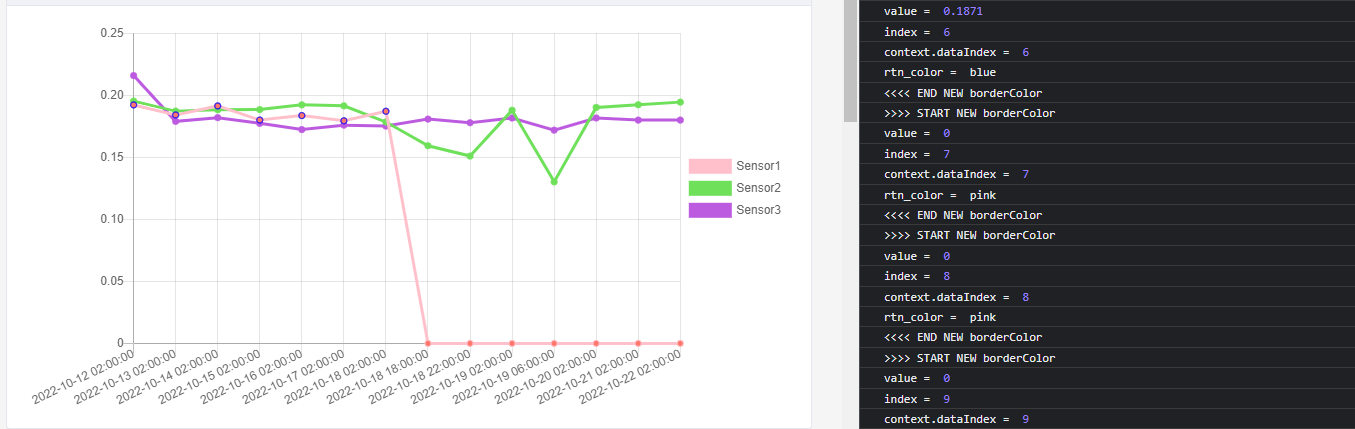
Thanks Sebastian.
But did not run :(
I have done this:
                "pointBackgroundColor" => "function(context) {
                    var index = context.dataIndex;
                    var value = context.dataset.data[index];
                    var rtn_color = 'blue';

                    if (value == null) {
                        rtn_color='white';
                    }

                    if (value <= 0) {
                        rtn_color='white';
                    }

                    rtn_color = 'blue';

                    return rtn_color;
}",
Best
Pls replace these lines:
                    var value = context.dataset.data[index];
                    ...
                    return rtn_color;
with these ones:
                    var value = parseFloat(context.dataset.data[index]);
                    console.log('value = ', value);
                    ...
                    console.log('rtn_color = ', rtn_color);
                    return rtn_color;
Then open your browser's dev tool (F12), reload your page and see console.log output in dev tool's console. Rgds,
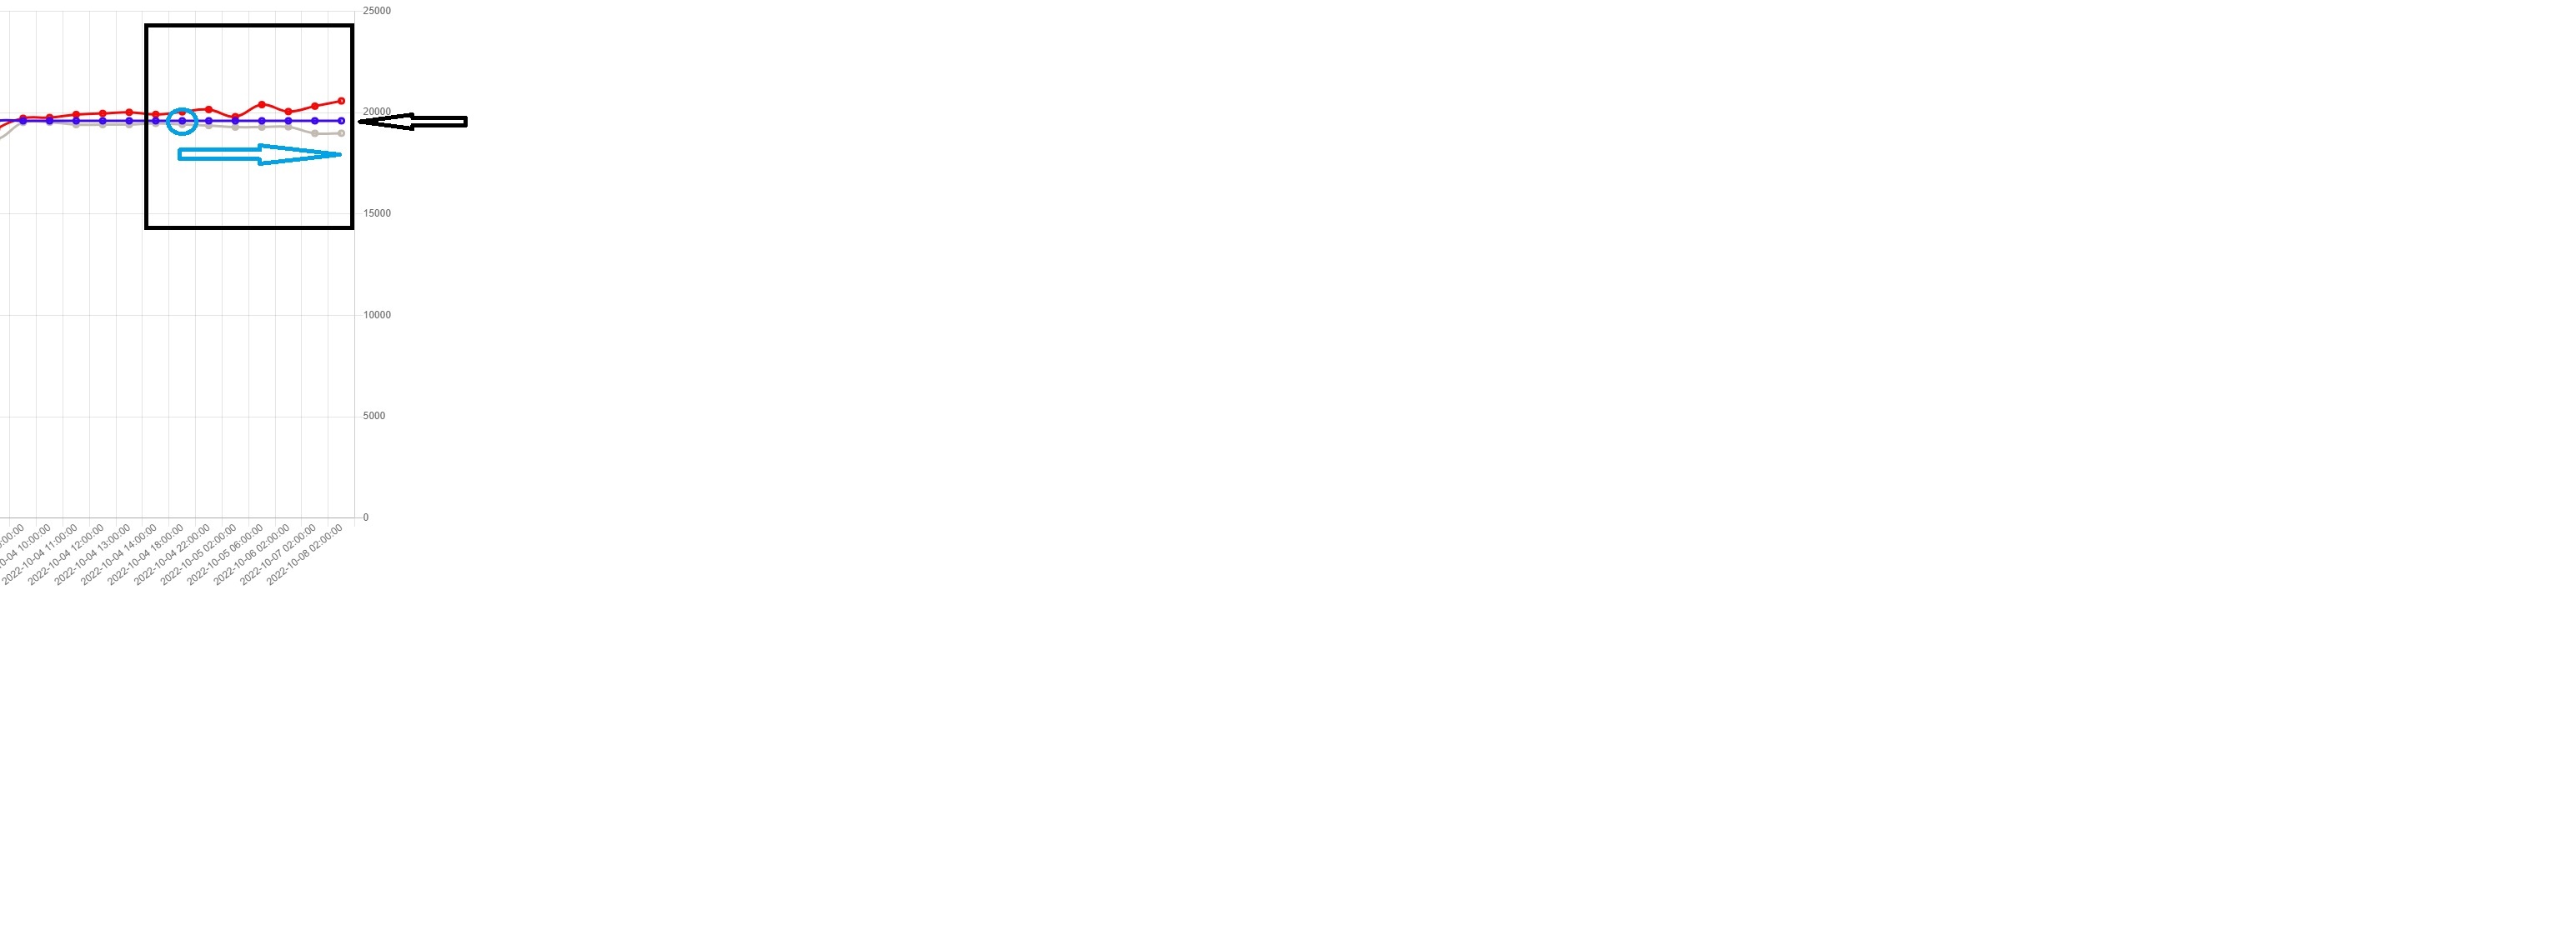
It seems "borderColor" only applies the last value and the line can only have one color. This is a limitation of Chartjs client 2.x. We will add Chartjs client 3.x in the next version of KoolReport so that you could apply different colors/styles for each line segment. Rgds,
Build Your Excellent Data Report
Let KoolReport help you to make great reports. It's free & open-source released under MIT license.
Download KoolReport View demo