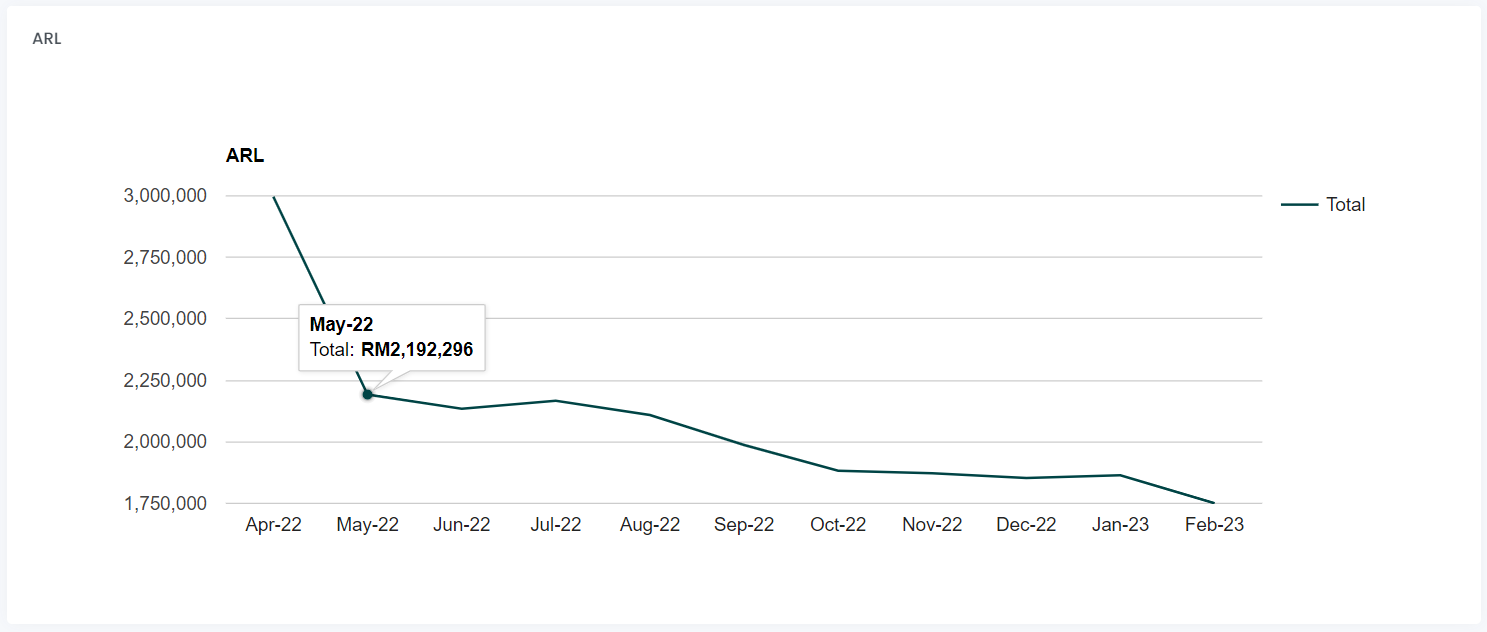
Can you guide me how to display the value in the Line chart rather than need to mouse rollover on it?
Dashboard package :
<?php
namespace App\Dashboard\SI;
use koolreport\dashboard\widgets\google\LineChart; use \koolreport\dashboard\fields\Text; use \koolreport\dashboard\fields\Currency; use \koolreport\dashboard\ColorList;
use App\Dashboard\AutoMaker;
class ARLSI extends LineChart {
protected function onInit()
{
  $this->title("ARL")
    ->colorScheme(ColorList::random());
}

protected function dataSource()
{
            $range = $this->sibling("SIDateRange")->value();

	$datefrom = $range[0];
	$dateto = $range[1];

	return AutoMaker::rawSQL("
                    Select SIDate ,  total
		from SI_HDR
		where SIDate between '$datefrom' and '$dateto'
			");
}

protected function fields()
{
    return [
        Text::create("SIDate "),
        Currency::create("total")
                ->MYR()
                ->symbol()
                ->decimals(0)
    ];
}
} ?>