KoolReport's Forum
Official Support Area, Q&As, Discussions, Suggestions and Bug reports.
Forum's Guidelines
DrillDown - chartJS #370
Open Jure Zakrajsek opened this topic on on Jul 12, 2018 - 6 commentsI am sorry that currently DrillDown are working with Google Chart only but in next release, it will work with chartJs, Morris Chart, datagrid as well.
The only option available now is that you use the CustomDrillDown. This widget allows you to put virtually anything on each level of drilldown. So you can put chart, table, custom content there. Only thing you have to do is the write custom item select event at each level and tell DrillDown to move next level with user selection.
CustomDrillDown is powerful but rather complex, but a bit only. DrillDown is very easy option but less flexibility.
Hi
Thx for the advice. Looking forward on this update it should be really great. Im already using CustomDrillDown due to the fact that my database is large and I prefere to do the grouping with queries insted of the koolreport grouping.
I would apreciate if you have any examples of CustomDrill reports with at least 2 levels (im new to php and it is not so easy as python). I have some difficulties to get the selected first level item back to the query once i move to the third level. I get the last level back to the next query with the param array in the $drilldown.next function, i can also add a key "selected_year" and value for the previous level, but cant figure out how to get the actual value of the previous level $this->param["selected_year"] as a value to this key in the $drilldown.next function My clientEvent
"clientEvents"=>array(
    "itemSelect"=>"function(params){
		$drilldown.next({selected_month:params.selectedRow[0], selected_year:2017});
    }",
),
Also i have some problems with the x-axis format. My query would return YEAR(date) as obs_year and MONTH(date) as obs_month. The ColumnChart however understands this as numbers and not as date. I tried to add formating to the "column" array, but this seems to format only the values in the tooltip and not on the x-axis
"columns"=>array(
    "obs_year"=>array(
        "label"=>"Year",
        "type"=>"date",
        "format"=>"Y",
        "displayFormat"=>"Y",
    ),
Thank you for any advice Best regards Jure
Hi, a good new coming for new week, we have release version 2.78.0 of KoolReport Pro. It contains ChartJs 1.2.0 and DrillDown 2.0.0. In this version, Drilldown is able to work with koolphp/Table as well as the ChartJS. May be it will be easier for you to use the DrillDown.
For your questions regarding CustomDrillDown:
- In the Month subreport, you already have the $this->params["selected_year"] so you can use it in the next() function.
- Could you please tell me what do you want the x-axis to look like?
Hi, I managed to use the ChartJS in the CustomDrillDown. The ChartJS also understands the categories on the x-axis better.
For the first question i have solved the problem with the code like this, perhaps it will be usefull to someone else:
"clientEvents"=>array(
    "itemSelect"=>"function(params){
        $drilldown.next({selected_year:".$this->params['selected_year'].",selected_month:params.selectedRow[0]});
    }",
)
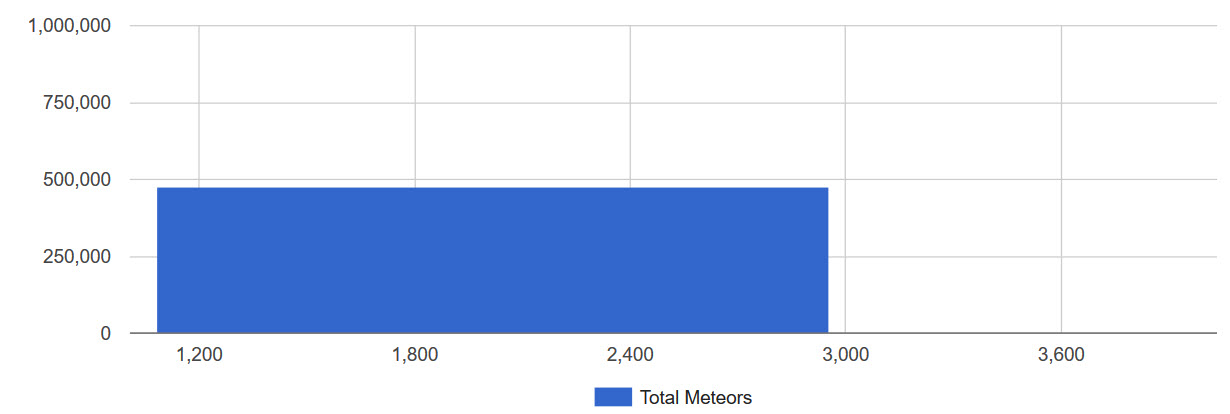
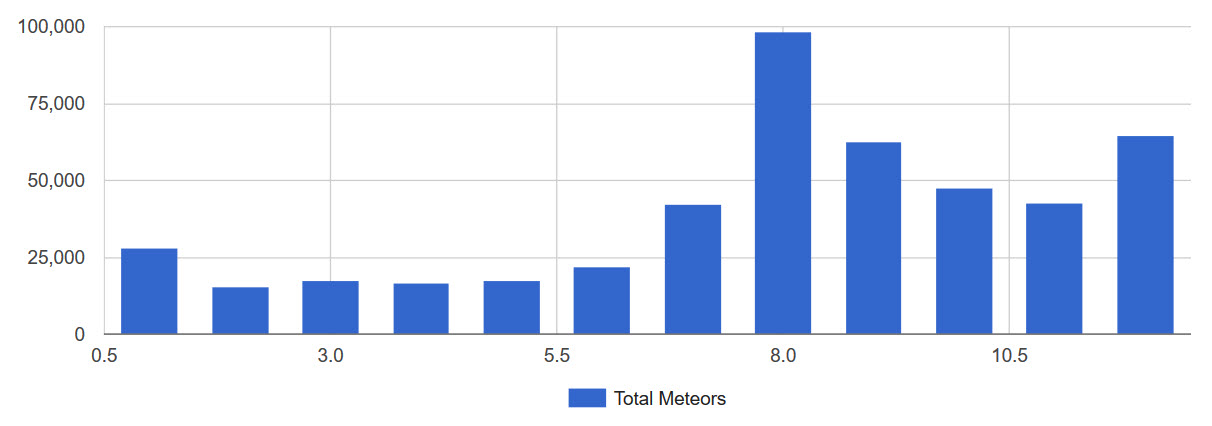
Google Charts gives me such grafs (numbers on the x-axis). The first should have only year 2016 and the second has months from 01 -> 12. If possible i would like to display these as Jan, Feb ... Dec.


Best regards Jure
I see,
I think you should format the obs_month like this:
"columns"=>array(
    "obs_month"=>array(
        "label"=>"Month",
        "type"=>"date",
        "format"=>"m",
        "displayFormat"=>"M", //Display Jan, Feb
    ),
For the year, you may try to adding a space in front "dataFormat"=>" Y".
Please try to see how.
The "columns" parameters array seem to have effect only on the values in the tooltip but not on the x-axis. I figured it out by seting the option for the hAxis to be categorical, like the example below.
"options"=>array(
    "legend"=>array(
        "position"=>"bottom",
    ),
    "hAxis"=>array(
        "type"=>"category",
    ),
),
Thx
Build Your Excellent Data Report
Let KoolReport help you to make great reports. It's free & open-source released under MIT license.
Download KoolReport View demo