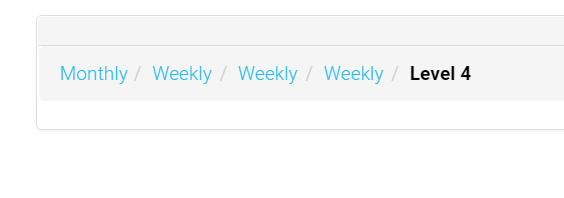
So I have no idea why the drilldown is doing what it is doing. I know it has something to do with the xAxis but I can't see what in my data or setup would cause this. Like many problems the longer you stare at it the less visible certain things become so I am hoping fresh eyes will see something that I can't. Below is the datasource arrays and ColumnChart setups. In a previous post I included my CustomDrilldown details.
Hopefully someone will be able to see the issue and let me know.
Monthly datasource array
array (0 => array('month' => 'August', 'Oktoberfest 2018' => 275, 'Pancake Breakfast' => 0, 'Italian Dinner' => 0, 'Christmas Cocktail' => 0, 'New Year\'s Eve Boog-a-loo' => 0,),
1 => array ('month' => 'September', 'Oktoberfest 2018' => 2625, 'Pancake Breakfast' => 0, 'Italian Dinner' => 0, 'Christmas Cocktail' => 0, 'New Year\'s Eve Boog-a-loo' => 0,),
2 => array ('month' => 'October', 'Oktoberfest 2018' => 0, 'Pancake Breakfast' => 255, 'Italian Dinner' => 710, 'Christmas Cocktail' => 0, 'New Year\'s Eve Boog-a-loo' => 0,),
3 => array ('month' => 'November', 'Oktoberfest 2018' => 0, 'Pancake Breakfast' => 10, 'Italian Dinner' => 190, 'Christmas Cocktail' => 3025, 'New Year\'s Eve Boog-a-loo' => 0,),
4 => array ('month' => 'December', 'Oktoberfest 2018' => 0, 'Pancake Breakfast' => 0, 'Italian Dinner' => 0, 'Christmas Cocktail' => 400, 'New Year\'s Eve Boog-a-loo' => 820,),
)
ColumnChart::create(array(
"dataSource"=>$this->dataSource,
"title"=>"Monthly Transaction Report",
"columns"=>array ( 'month',
'Oktoberfest 2018' => array ('label' => 'Oktoberfest 2018', 'type' => 'number', 'prefix' => '$',),
'Pancake Breakfast' => array ('label' => 'Pancake Breakfast', 'type' => 'number', 'prefix' => '$',),
'Italian Dinner' => array ('label' => 'Italian Dinner', 'type' => 'number', 'prefix' => '$',),
'Christmas Cocktail' => array ('label' => 'Christmas Cocktail', 'type' => 'number', 'prefix' => '$',),
'New Year\'s Eve Boog-a-loo' => array ('label' => 'New Year\'s Eve Boog-a-loo', 'type' => 'number', 'prefix' => '$',),
),
		"clientEvents" => array(
			"itemSelect"=>"function(params){
			$drilldown.next({month:params.selectedRow[0]".$this->drillDownEvent."});
}",
),
));
Weekly datasource array
array (0 => array ('week' => 'Oct 29', 'Italian Dinner' => 150, 'Pancake Breakfast' => 0, 'Christmas Cocktail' => 0,),
1 => array ('week' => 'Nov 05', 'Italian Dinner' => 40, 'Pancake Breakfast' => 10, 'Christmas Cocktail' => 0,),
2 => array ('week' => 'Nov 12', 'Italian Dinner' => 0, 'Pancake Breakfast' => 0, 'Christmas Cocktail' => 100,),
3 => array ('week' => 'Nov 19', 'Italian Dinner' => 0, 'Pancake Breakfast' => 0, 'Christmas Cocktail' => 2500,),
4 => array ('week' => 'Nov 26', 'Italian Dinner' => 0, 'Pancake Breakfast' => 0, 'Christmas Cocktail' => 425,),
)
ColumnChart::create([
"dataSource"=>$this->dataSource,
"title"=>"Weekly Report",
"columns"=>array ( 'week',
'Italian Dinner' => array ('label' => 'Italian Dinner', 'type' => 'number', 'prefix' => '$',),
'Pancake Breakfast' => array ('label' => 'Pancake Breakfast', 'type' => 'number', 'prefix' => '$',),
'Christmas Cocktail' => array ('label' => 'Christmas Cocktail', 'type' => 'number', 'prefix' => '$',),
),
"clientEvents" => [
"itemSelect"=>"function(params){
$drilldown.next({week:params.selectedRow[0]".$this->drillDownEvent."});
}",
],
"options"=>[
"barThickness"=>100,
"scales"=> [
"yAxes"=>[["ticks"=>["suggestedMin"=>0]]
]
]
]
]);

