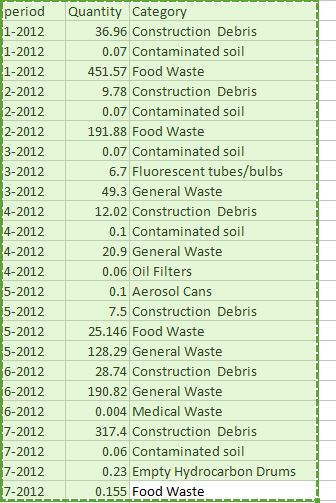
Hello Kool team, I am trying to develop the chart to show the following data with the following info x -axis => period y-axis=>quantity legend category => Category One major issue is how can I introduce the legend category which is different series without having to name them one by one. This is coming from the database direct and can be many. All I will want is to pass the options the user will want to plot to the chart for it to display the appropriate chart.
Is there anyway this can be done dynamically?
The data is shown below.
