I am trying to create a chart that shows number of items for each month (three different columns from SQL server). The SQL database has individual rows that contain among other data the following fields (date(a text field containing the date in the following format m/d/y) and equiptype(a text field containing the type of equipment). I am using a SQL select statement to count the number of each equipment type in each month. My SQL select statement is as follows:
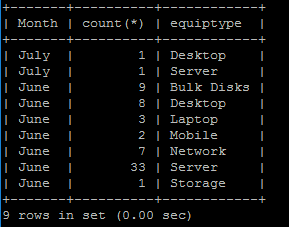
SELECT date_format(str_to_date(date,'%m/%d/%Y)'),'%M') as Month, count(*), equiptype from Decom GROUP BY Month,equiptype
The data returned is as follows:

I would like my chart to look similar to the following:

With Books, Accessories, etc being the Months and Sale, Cost, Profit being the type of equipment.
The code in my report file is a follows:
ColumnChart::create(array(
"title"=>"Disposals by Month",
"dataSource"=>$this->dataStore('permonth'),
"columns"=>array(
"Month",
"count(*)"=>array("label"=>"Number"),
"equiptype",
)
));
This gives me an error of All series on a given axis must be of the same data type. I can take out one of either Month or equiptype and get either number of records for each month or number of records for each equipment type, but cannot get a list of months with the number of each equipment type for that month. What am I missing?