KoolReport's Forum

Official Support Area, Q&As, Discussions, Suggestions and Bug reports.
Forum's Guidelines

Change scale for axes #300

Open mohammed opened this topic on on May 29, 2018 - 10 comments

mohammed commented on May 29, 2018

i have two problems: 1- i want to change the scale for axes in google charts, 2- i have overlap annotations when i show the label values above each column. how i can also put 'alwaysOutside'=> true

KoolReport commented on May 31, 2018

For change scale of a chart for example LineChart, you can do:

LineChart::create(array(
    ...
    "options"=>array(
        "vAxis"=>array(
            "scaleType"=>"log",
        )
    )
))

Since I am not sure how you want your scale to be so you can look at all advanced options you can set for Google Chart here

KoolReport commented on May 31, 2018

For the alwaysOutside, you do:

ColumnChart::create(array(
    ...
    "options"=>array(
        "annotations"=>array(
            "alwaysOutside"=>true
        )
    )
))
mohammed commented on Jun 6, 2018

how can i change min-value for Axis

KoolReport commented on Jun 6, 2018

You do this:

ColumnChart::create(array(
    ...
    "options"=>array(
        "vAxis"=>array(
            "minValue"=>3
        )
    )
))
mohammed commented on Jun 7, 2018

where i can find list of all available options?

KoolReport commented on Jun 7, 2018

Hi Mohammed,

Here is the full list of options Google ColumnChart options.

Hope that helps.

mike commented on Aug 7, 2018

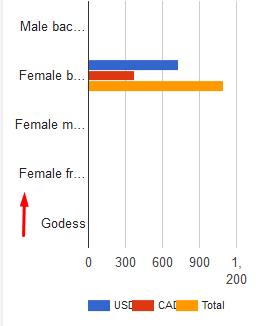
any solution for this .. vaxis label doesn't show full word ......it can break word if length is long ...

KoolReport commented on Aug 7, 2018

You may make the chart's width bigger.

mike commented on Aug 7, 2018

if I set chartArea more label will not display ..... is there any way to break word ....

David Winterburn commented on Aug 10, 2018

Hi Mike,

At the moment it seems that Google Chart has not supported multi-line vertical axis labels. One thing you could do to display whole vertical labels is set the left margin of the chart area bigger than default like this:

google\BarChart::create(array(
	"dataStore" => $this->dataStore('myReport'),
	"options" => array(
		'chartArea' => [
			'left' => 150
		]
	),
));

Also we appreciate very much if you create a new thread for a new issue if it is not the same as the old thread's issue. Thanks!

Build Your Excellent Data Report

Let KoolReport help you to make great reports. It's free & open-source released under MIT license.

Download KoolReport View demo
help needed

None