New report
Creating a new empty report #
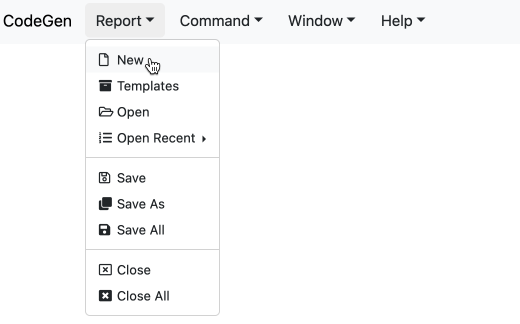
First choose menu item Report -> New:
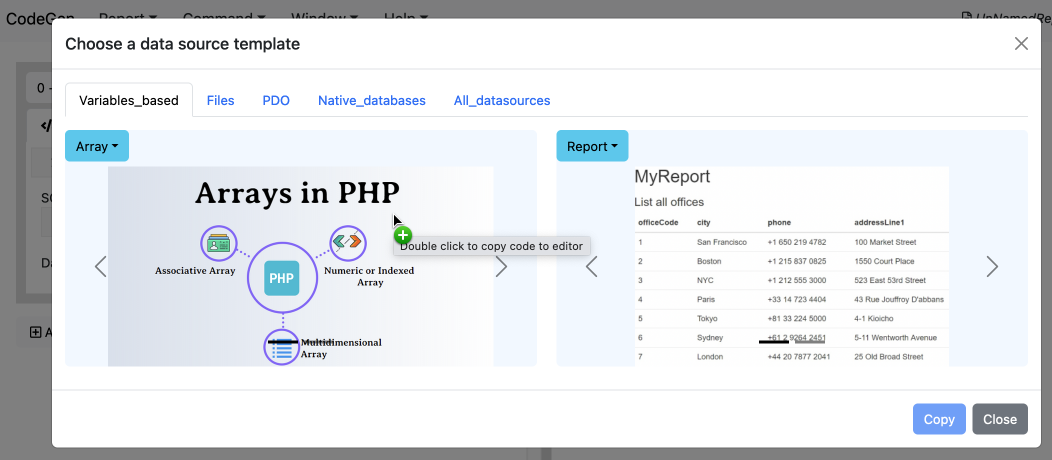
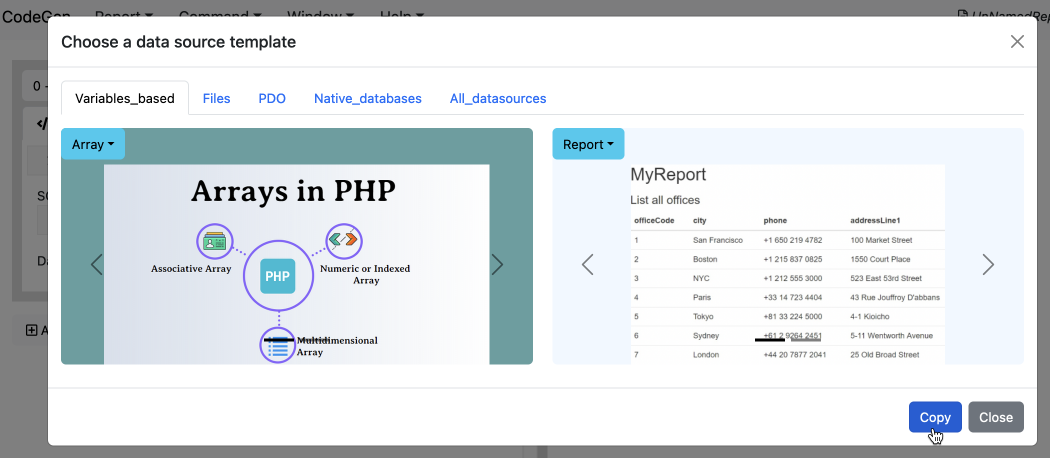
A modal of datasource templates is shown for users to choose. Users can either double click or select and click copy any template:
The selected template code will be copied to datasource item:
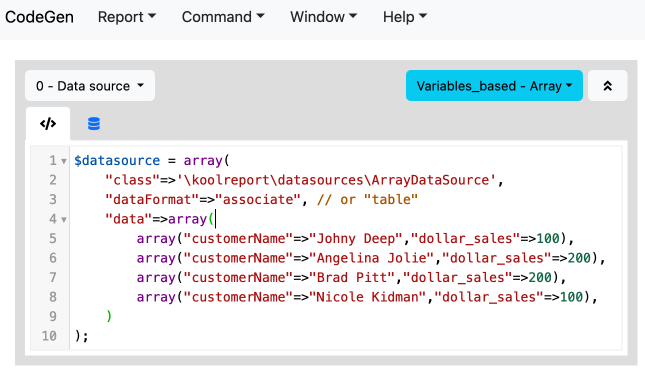
Note: A data source item's code must be a statement that defines a variable called $datasource:
$datasource = ...
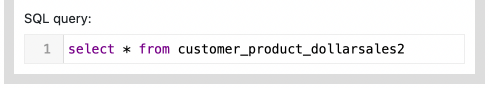
If your data source setting is of relational database type, there needs to be a SQL query as well to retrieve data from the sourced database:
If your data source setting is of report-based type, there needs to be a datastore name as well to retrieve data from the sourced report. The name should be formatted as "result_< number >" where < number > is the data result of process < number > of the sourced report:

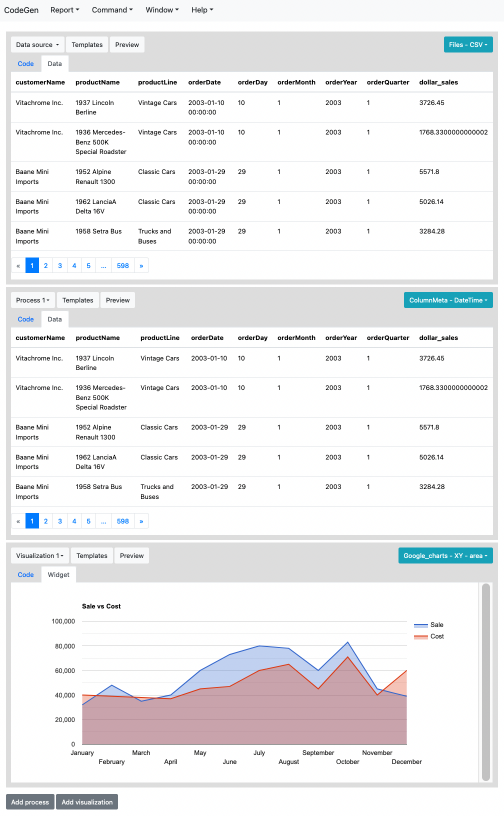
Edit the code to your likes and click on the item's dropdown menu Preview button to request a retrieved data preview:
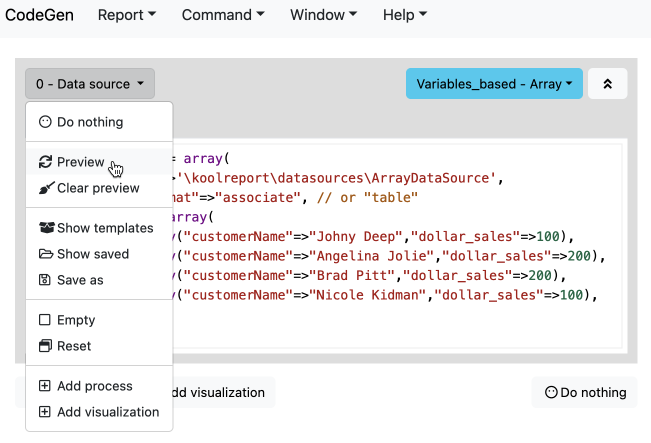
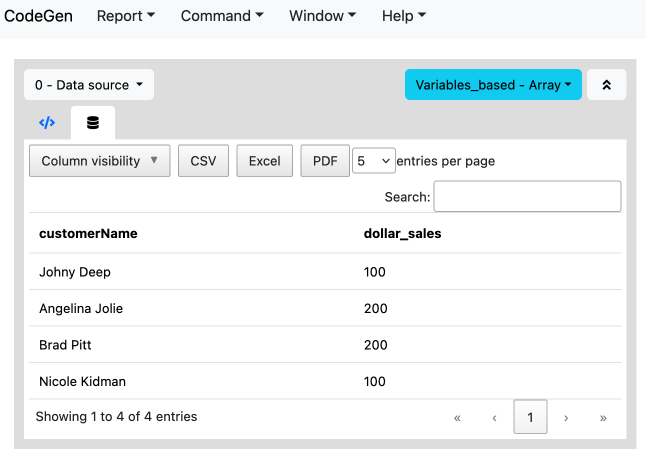
A data result is shown in table format:
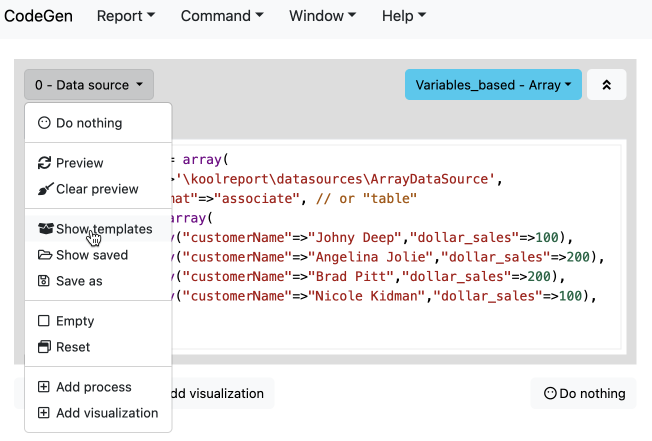
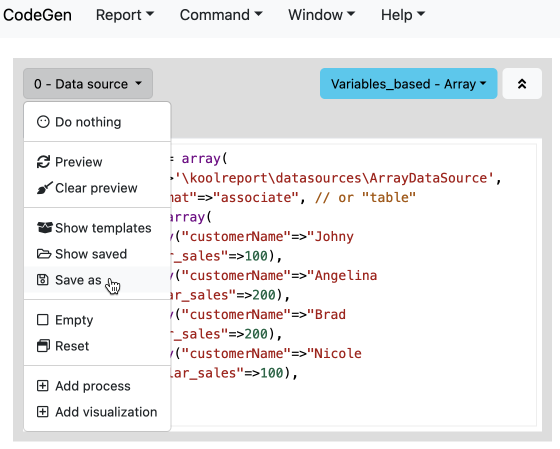
At any point you can show datasource templates again using its dropdown menu:
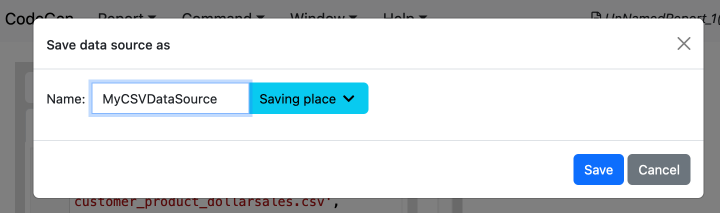
Users can save current datasource code by clicking dropdown menu Save as:
A dialog to choose the saved name and place is shown:
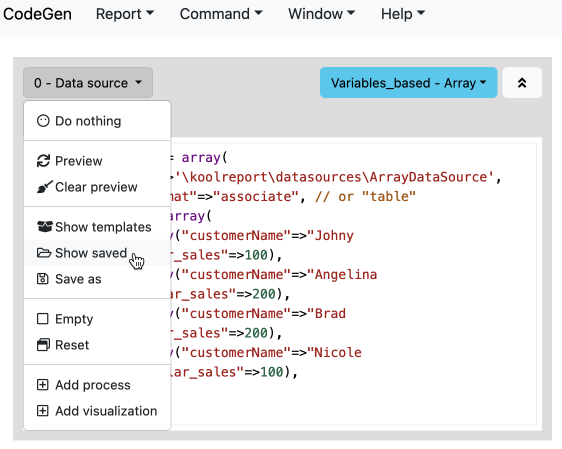
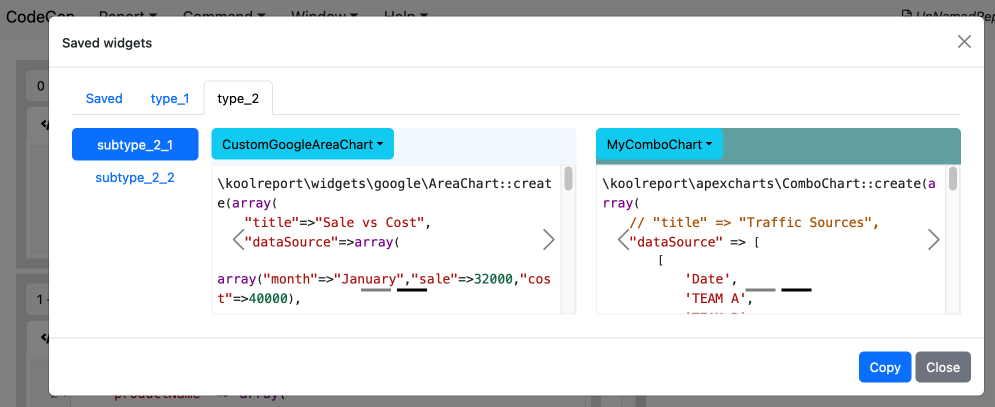
Later users can show saved datasources with dropdown menu Show saved:
A modal of saved datasources is shown:
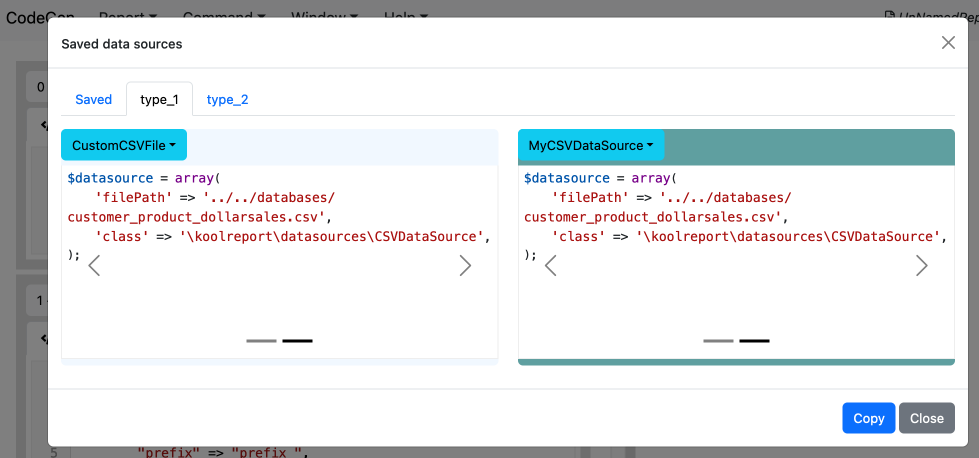
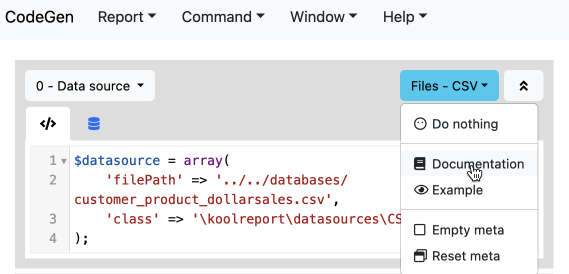
At the top right corner of a datasource is its meta dropdown menu where users can see a datasource template's documentation and example in the right panel.
Documentation menu:
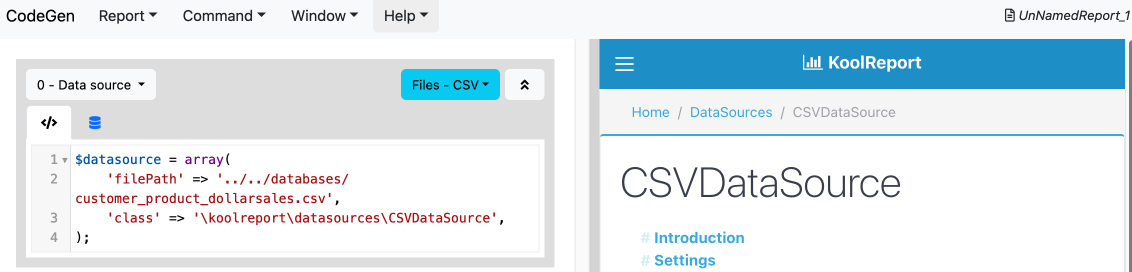
Documentation result:
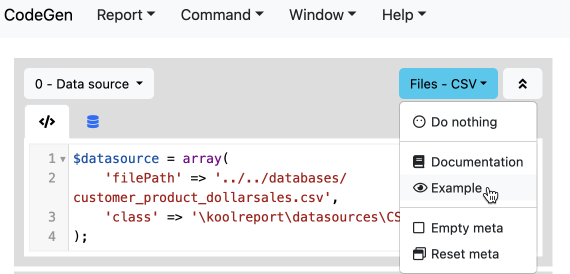
Example menu:
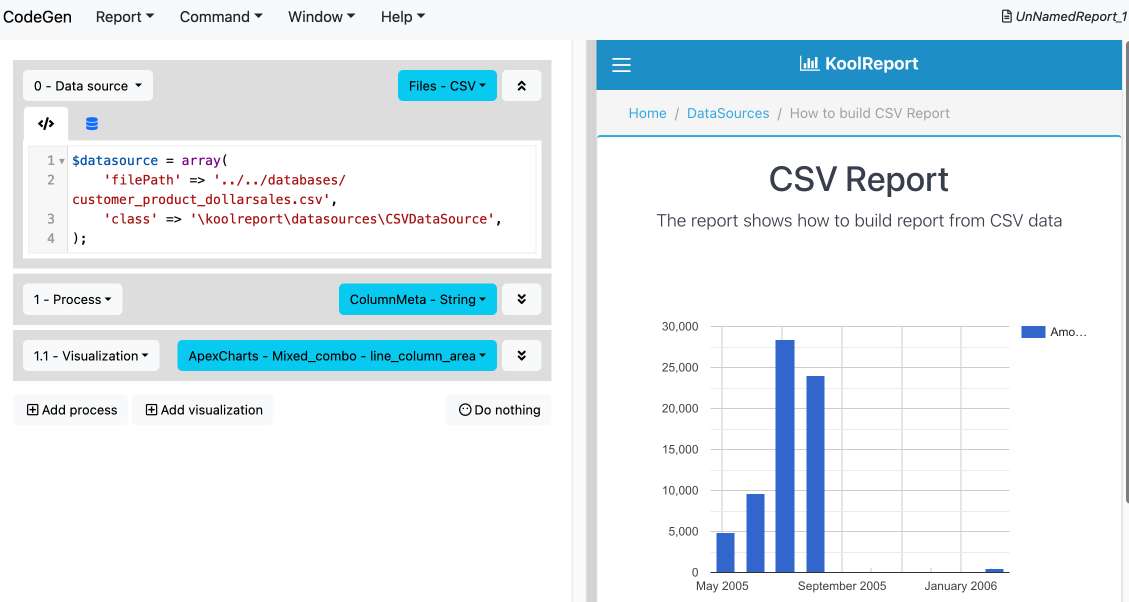
Example result:
Add a process #
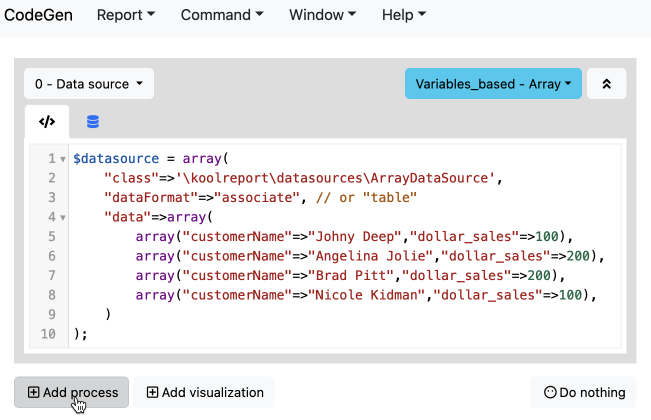
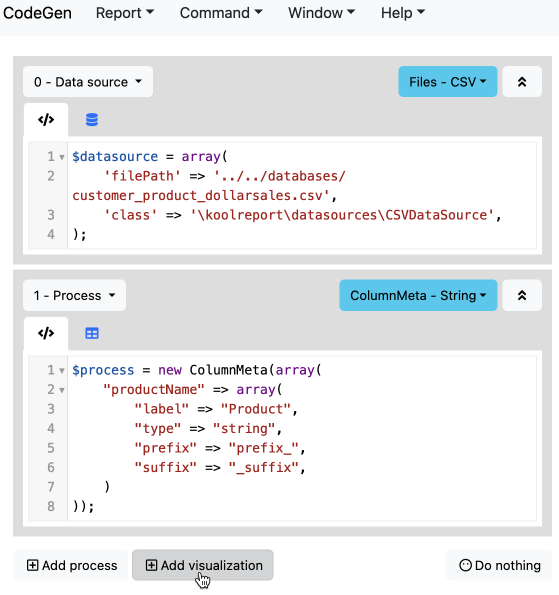
Once you have successfully got data from a datasource, click on Add Process dropdown menu
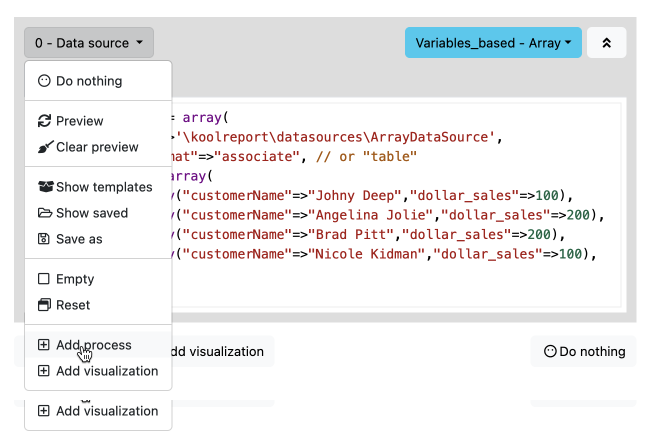
or Add process button at the end of the report to add a new process:
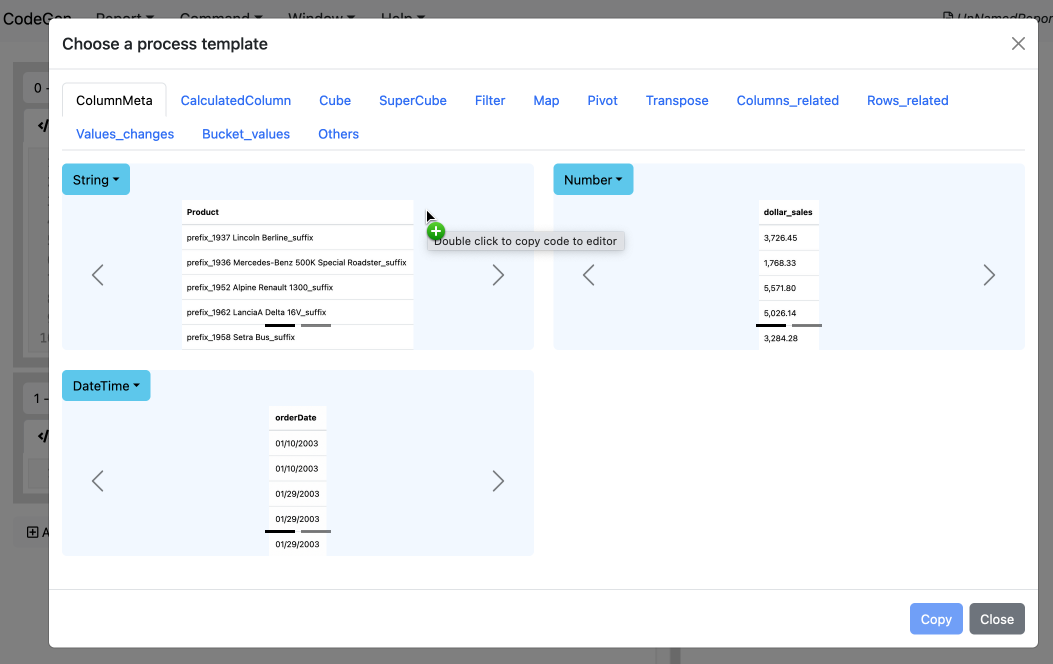
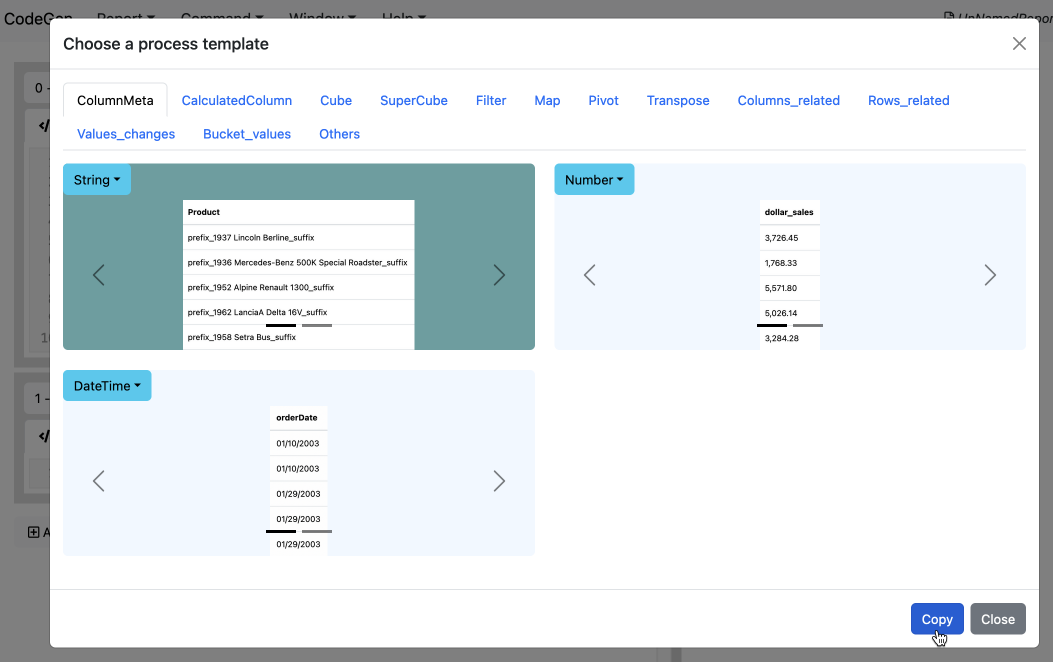
A modal of process templates is shown for users to choose. Users can either double click or select and click copy any template:
Note: A process item's code must be a statement that defines a variable called $process:
$process = ...
Each process uses the result data of the last process (or data source) before it and outputs its processed data to the next process or visualization.
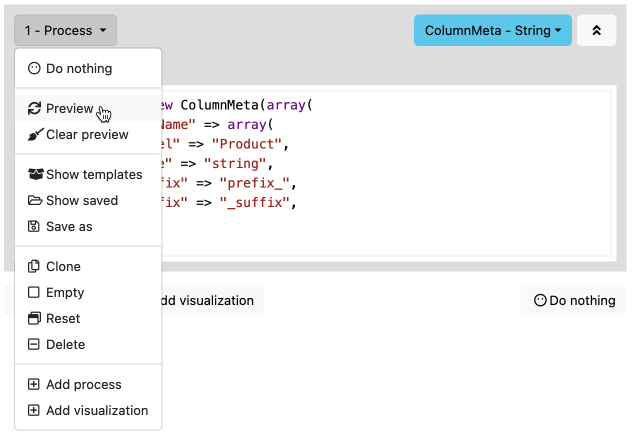
Edit the code to your likes and click on the process' dropdown menu Preview button to request a processed data preview:
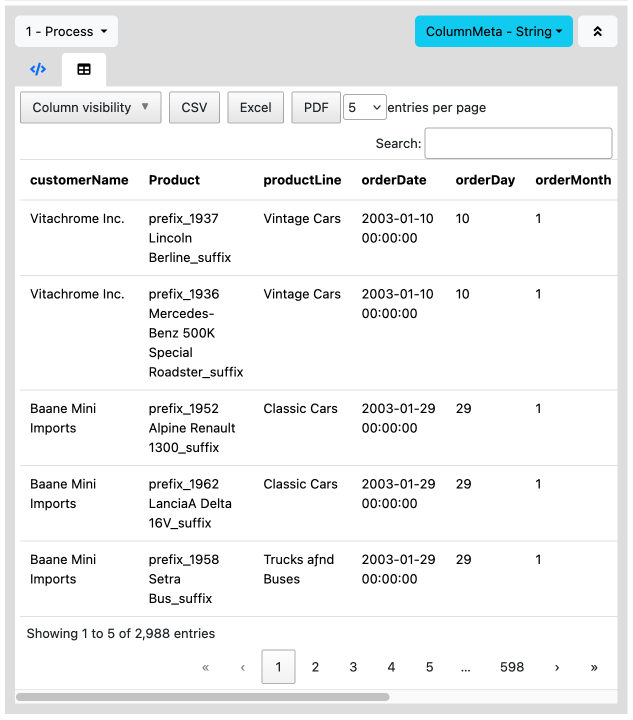
A data result is shown in table format:
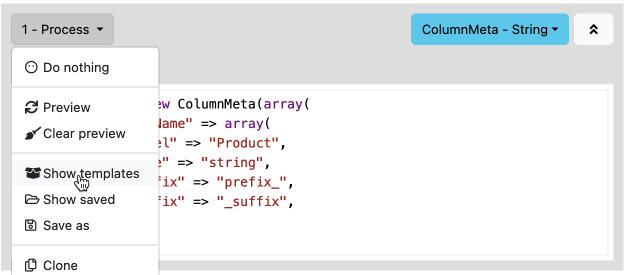
At any point you can show process templates again using its dropdown menu:
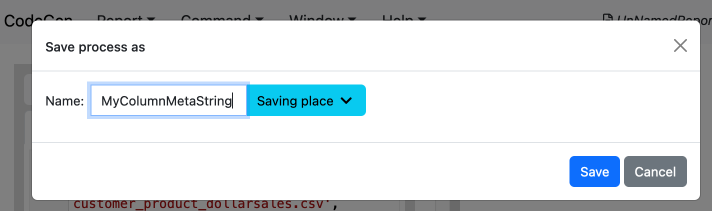
Users can save current process code by clicking dropdown menu Save as:
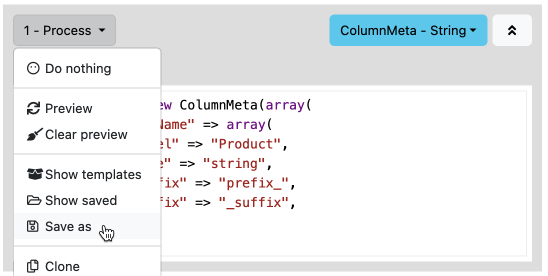
A dialog to choose the saved name and place is shown:
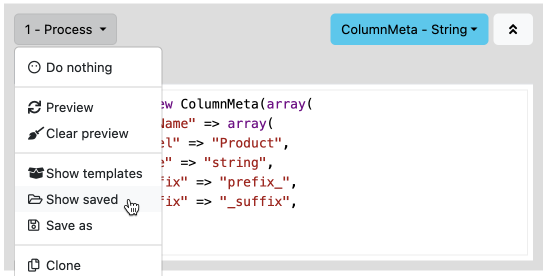
Later users can show saved processes with dropdown menu Show saved:
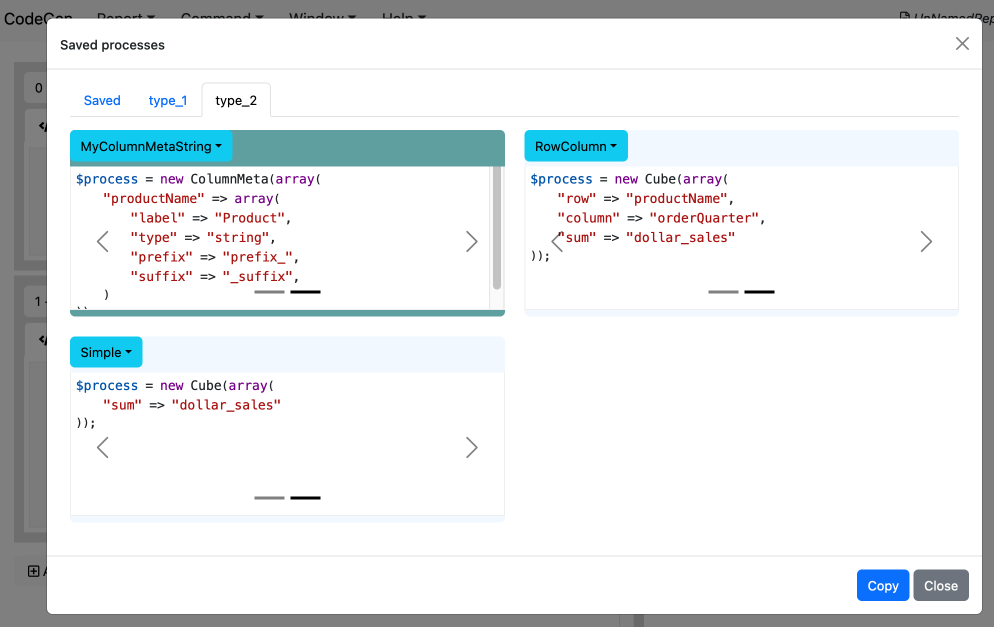
A modal of saved processes is shown:
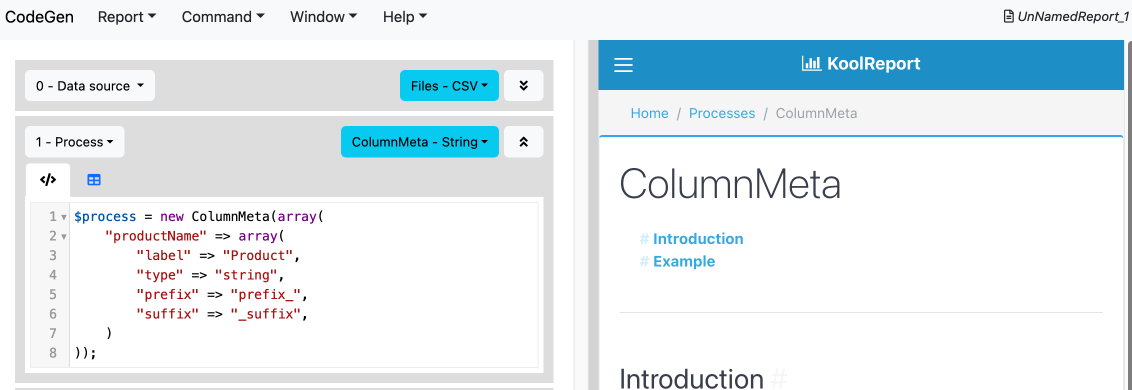
At the top right corner of a process is its meta dropdown menu where users can see a process template's documentation and example in the right panel.
Documentation menu:
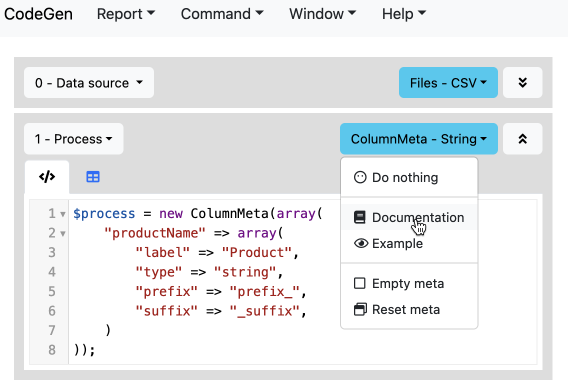
Documentation result:
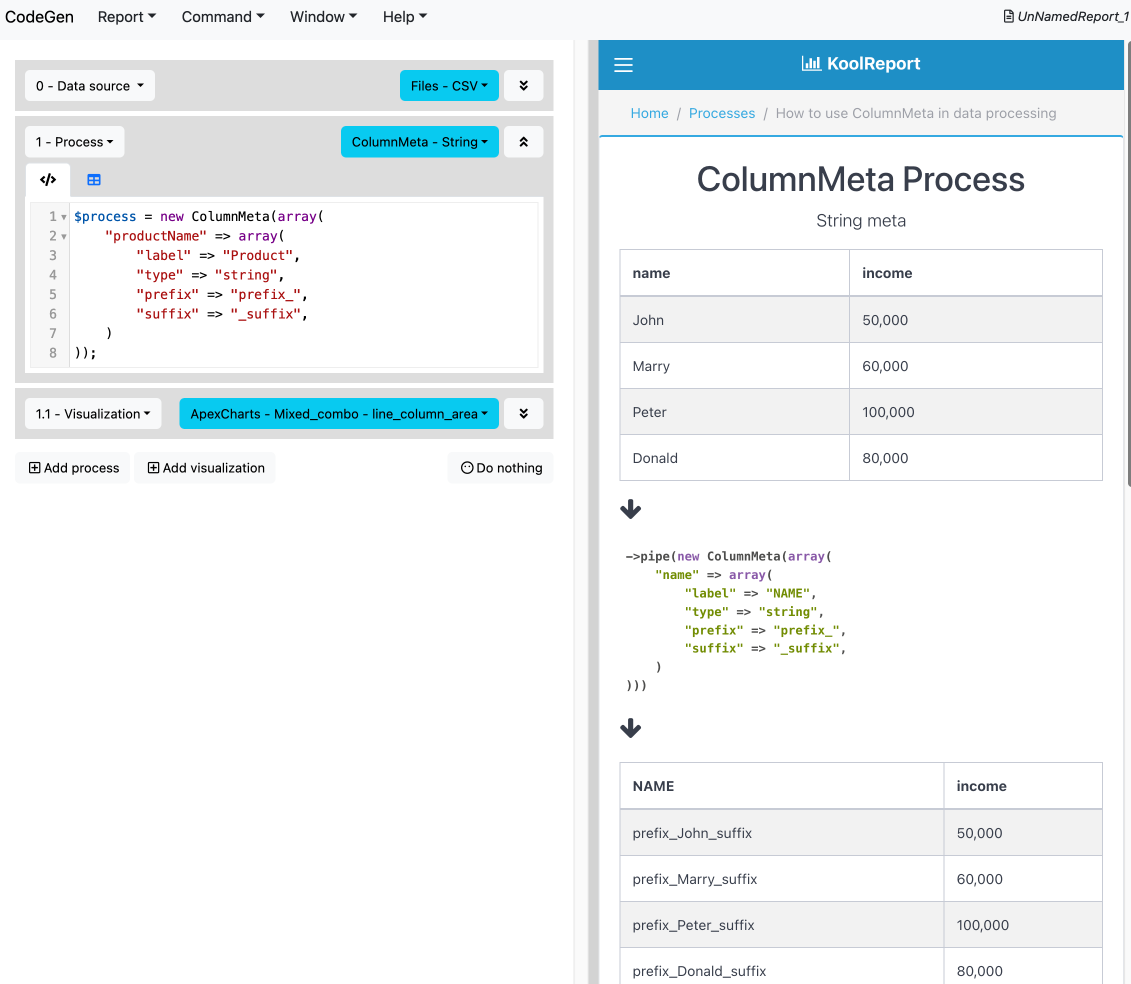
Example menu:
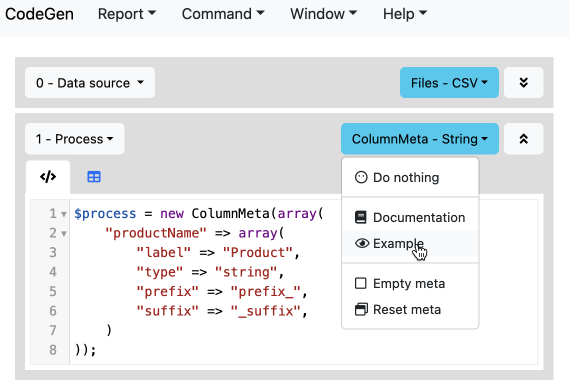
Example result:
Add a visualization #
Once you have successfully got data from the data source or a process item, click on Add visualization dropdown menu
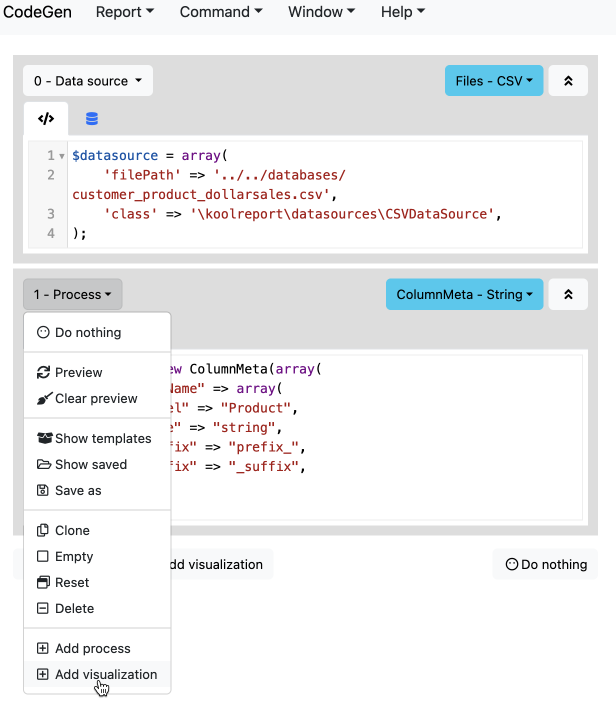
or Add visualization button at the end of the report to add a new process:
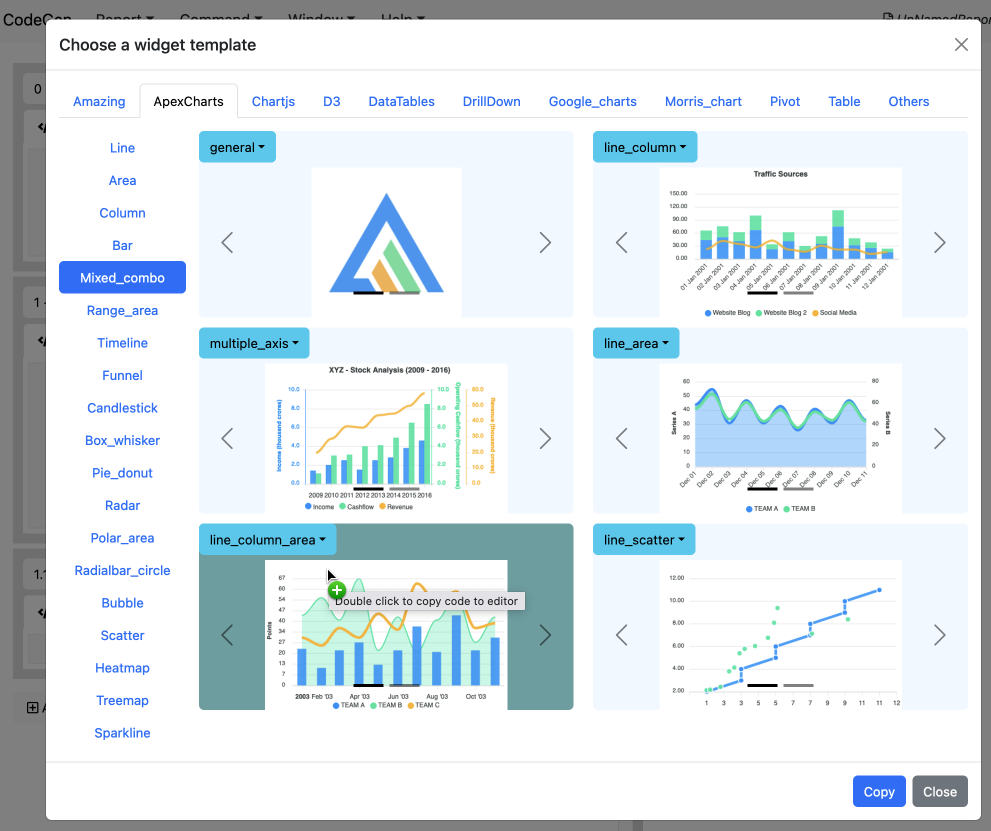
A modal of visualization templates is shown for users to choose. Users can either double click or select and click copy any template:
Note: A visualization item's code must be a statement that creates a KoolReport widget:
\koolreport\widgets\google\AreaChart::create(...);
All visualization template codes use example static array data. To use the result data of the last process (or data source) before a visualization change its "dataSource" line to:
"dataSource" => $this->dataStore("result"),
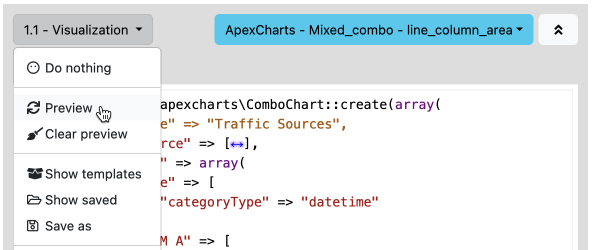
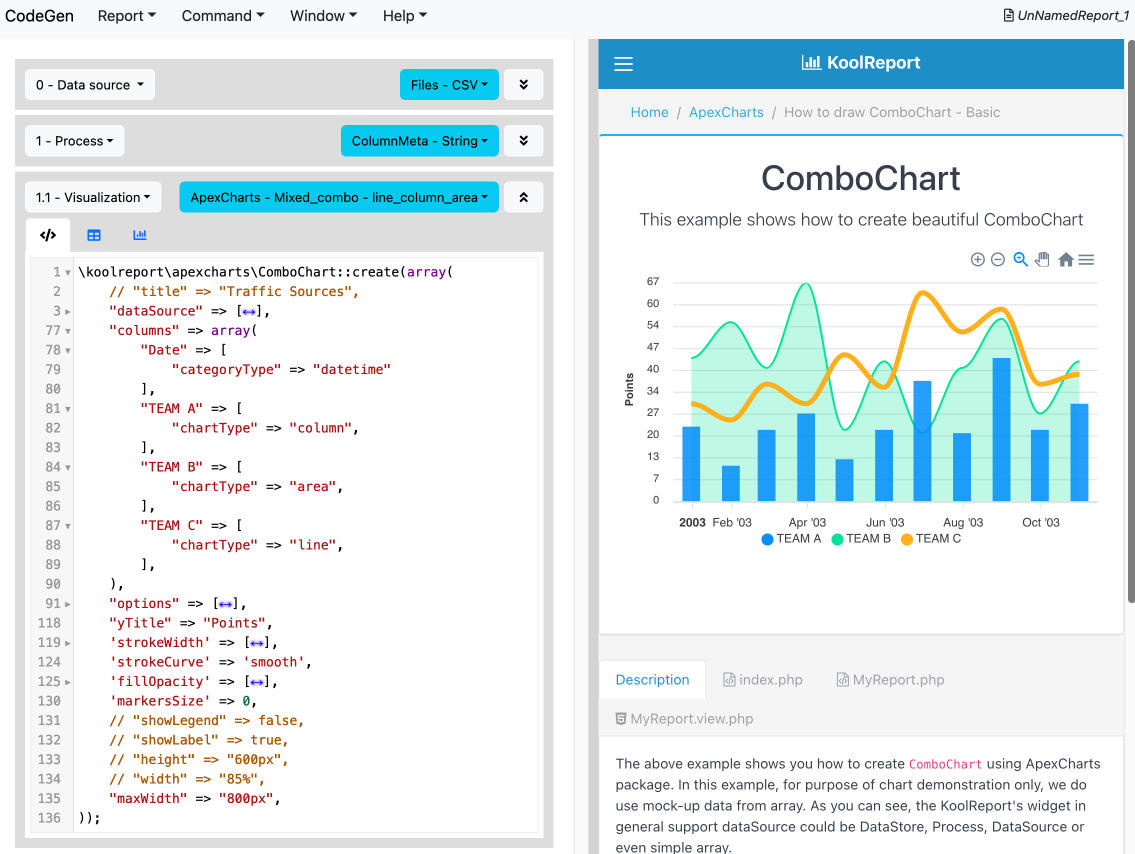
Edit the code to your likes and click on the visualization' dropdown menu Preview button to request a visualization preview:
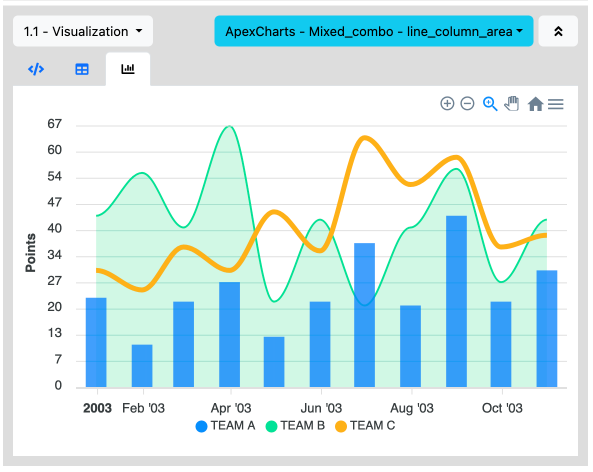
A visualization result is shown in table or chart format:
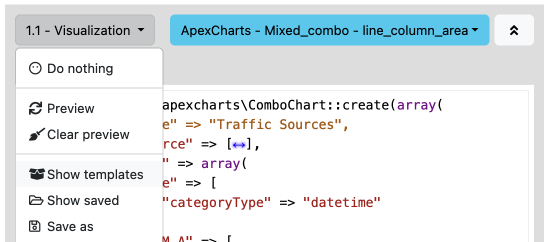
At any point you can show visualization templates again using its dropdown menu:
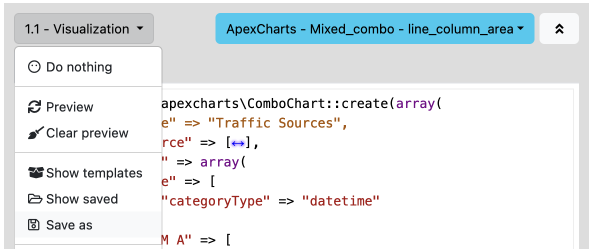
Users can save current visualization code by clicking dropdown menu Save as:
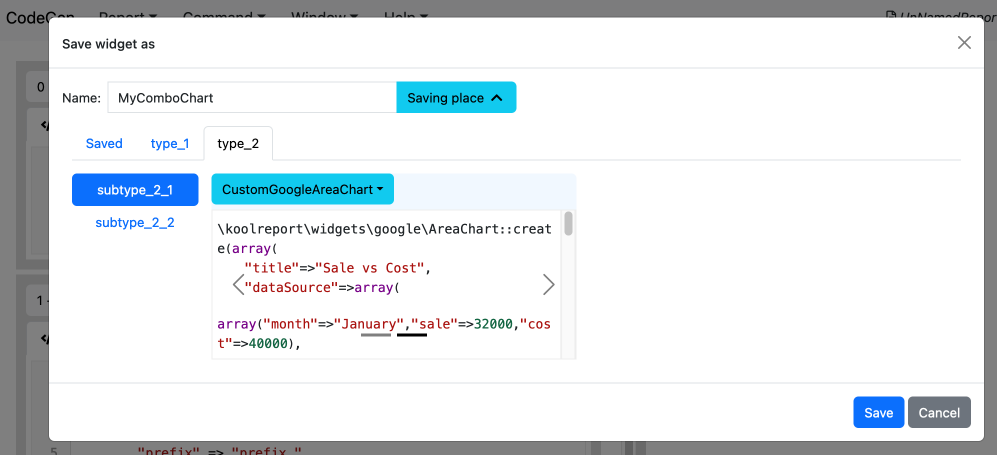
A dialog to choose the saved name and place is shown:
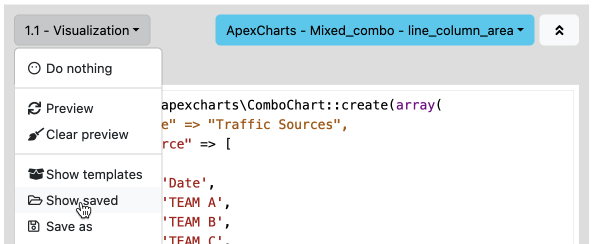
Later users can show saved processes with dropdown menu Show saved:
A modal of saved visualizations is shown:
At the top right corner of a visualization is its meta dropdown menu where users can see a visualization template's documentation and example in the right panel.
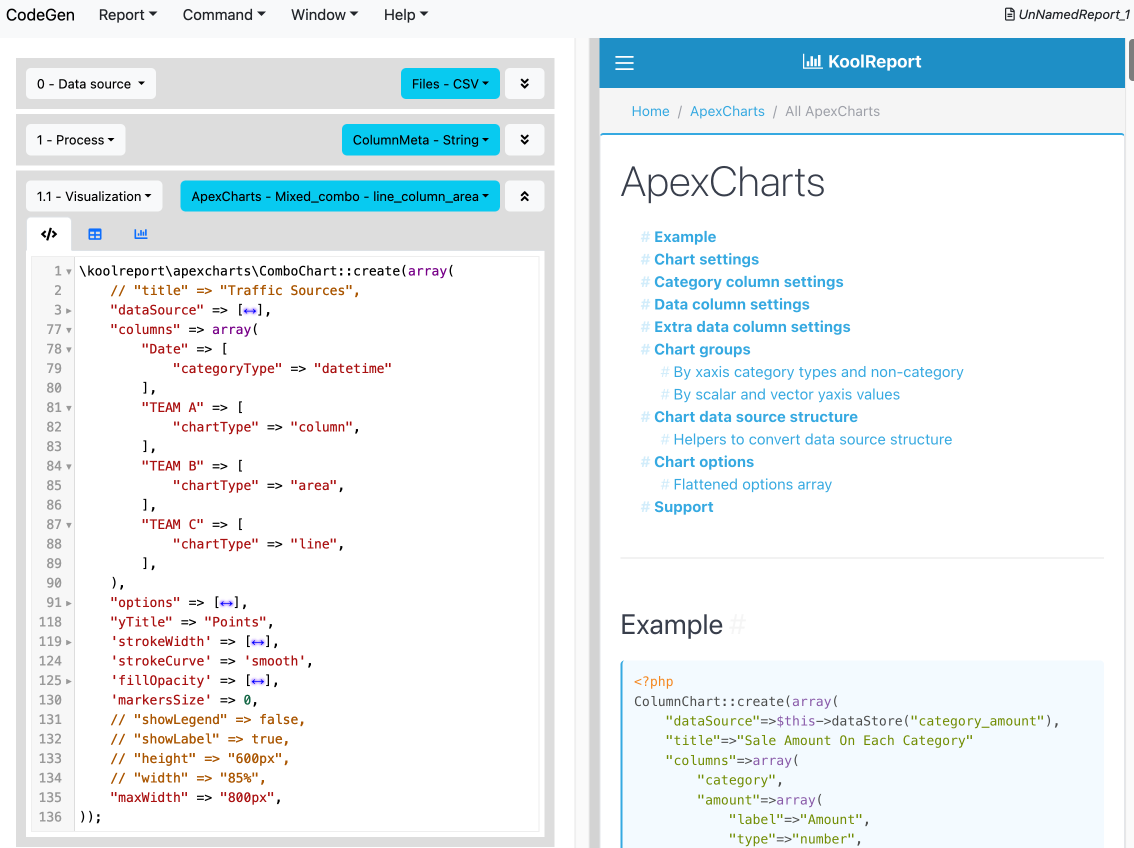
Documentation menu:
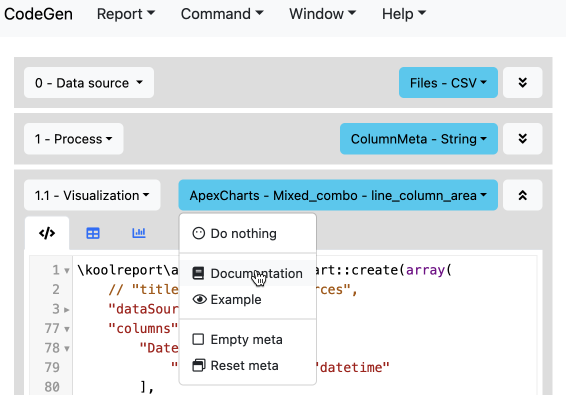
Documentation result:
Example menu:
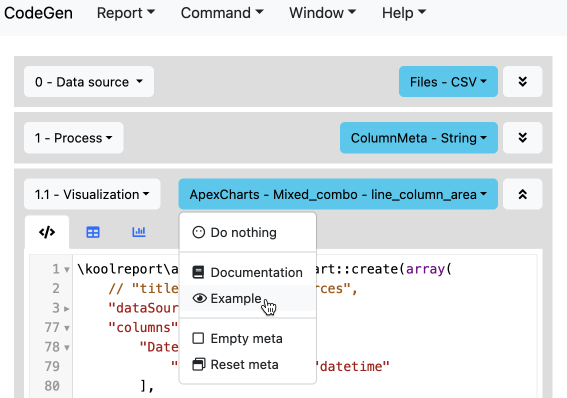
Example result:
Complete report #
Here is a simple report that includes a working data source, a working process, and a working visualization:
Get started with KoolReport
KoolReport will help you to construct good php data report by gathering your data from multiple sources, transforming them into valuable insights, and finally visualizing them in stunning charts and graphs.