Metrics
Overview #
KoolReport Dashboard metrics help you to gain insights of business indicators. For example, you can quickly summarize the number of sale per day or week or you can count number of registered users within period of time.
Metric widget is derived from Widget so it inherits all features of widget. There are 3 types of metrics: value, trend and category. We will go through each of them and learn how to use.
Value #
Value metric display a single value and if desired, compared to value in previous period. For example, we summarize the payment that we received within time period.
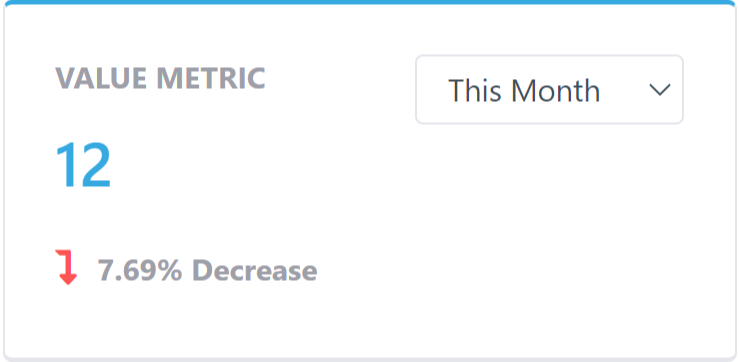
Here is the sample of an value metric:
<?php

use \koolreport\dashboard\metrics\Value;
use \koolreport\dashboard\fields\Date;
use \koolreport\dashboard\fields\Currency;

class PaymentReceived extends Value
{
    protected function dataSource()
    {
        return AutoMaker::table("payments");
    }

    protected function fields()
    {
        return [
            Date::create("paymentDate"),
            $this->sum(
                Currency::create("amount")->USD()->symbol();
            )
        ];
    }
}
In above example, we provide table payments as datasource. A Date or DateTime column will be required in the first fields list, followed by a numeric column. In here we have currency amount field and we would like to sum the currency fields based on paymentDate time.
Properties #
| Name | type | default | description |
|---|---|---|---|
defaultRange | string | The default range will be used on the first load when user has not selected any range | |
selectedRange | string | Get/set the name of selected range | |
title | string | Get/set the title of value | |
type | string | Get/set the title of Value metrics | |
ranges | string | Get/set the ranges of menu selection | |
helper | string | Get/set the text that will be shown when user move mouse over the value metrics |
Note: Those above properties follows this code rules.
Aggregates #
Provided in the fields() method are two fields. The first field is always date time, the second field is aggregated field. We provide you with built-in method for field aggregation. Those below built-in method returns a Number field to wrap the field that you want to calculate. So you can provide extra number format settings after aggregating.
| Name | description |
|---|---|
sum($numeric_field) | Get sum value of a numeric field and compare to value in previous range |
count($any_field) | Count the field and compare to value in previous range |
min($numeric_field) | Get the min of a numeric field within selected range and compare to value in previous range |
max($numeric_field) | Get the min of a numeric field within selected range and compare to value in previous range |
avg($numeric_field) | Get a average of a numeric field within selected range and compare to value in previous range |
Examples:
//Sum the unit field and format with "units at suffix"
$this->sum(
    Number::create("unit")
)->suffix("units")

//Average the votes and format with 2 number in decimals.
$this->avg(
    Number::create("vote")
)->decimals(2)
Ranges #
You can customize the list of ranges in ranges() methods. This method determines the ranges that will be available in the value metric's selection menu. The array's key will be the human readable text appeared in the menu while the array's value will be the array containing range. We provide number of preset range for you.
class PaymentValue extends Value
{
    protected function ranges()
    {
        return [
            "Today"=>$this::today(),
            "Yesterday"=>$this::yesterday(),
            "This Week"=>$this::thisWeek(),
            "Las Week"=>$this::lastWeek(),
            "Last 7 Days"=>$this::last7days(),
            "Last 30 Days"=>$this::last30days(),
            "This Month"=>$this::thisMonth(),
            "Last Month"=>$this::lastMonth(),
            "This Quarter"=>$this::thisQuarter(),
            "Last Quarter"=>$this::lastQuarter(),
            "This Year"=>$this::thisYear(),
            "Last Year"=>$this::lastYear(),
        ];
    }

}
Actions #
actionSelect() #
protected function actionSelect($request, $response)
Above actionSelect method will be called when use select a range in the Value metric and let you handle the event
Example:
class MyValue extends Value
{
    protected function actionSelect($request, $response)
    {
        //Do anything on select
    }
}
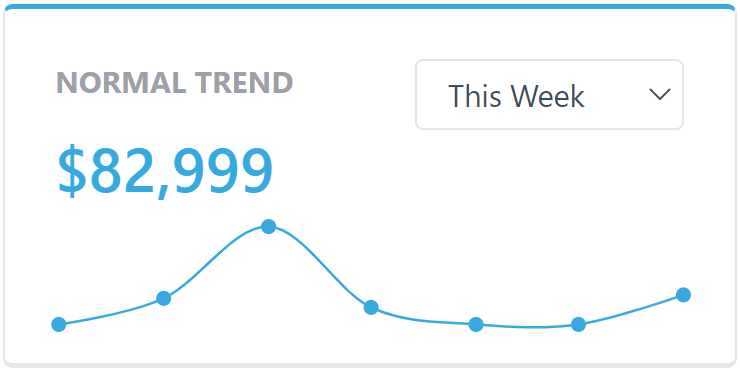
Trend #
Trend metrics display value over time using line chart. For example, a trend metric can display your daily sale within a month.
Example:
<?php

use \koolreport\dashboard\metrics\Trend;
use \koolreport\dashboard\fields\Date;
use \koolreport\dashboard\fields\Currency;

class PaymentRecievedTrend extends Trend;
{
    protected fucntion dataSource()
    {
        return AutoMaker::table("payments");
    }

    protected function fields()
    {
        return [
            $this->group(
                Date::create("paymentDate")
            ),
            $this->sum(
                Currency::create("amount")->USD()->symbol();
            )
        ];
    }

    protected function ranges()
    {
        return [
            "Today"=>$this::today(),
            "Yesterday"=>$this::yesterday(),
            "This Week"=>$this::thisWeek(),
            "Las Week"=>$this::lastWeek(),
            "Last 7 Days"=>$this::last7days(),
            "Last 30 Days"=>$this::last30days(),
            "This Month"=>$this::thisMonth(),
            "Last Month"=>$this::lastMonth(),
            "This Quarter"=>$this::thisQuarter(),
            "Last Quarter"=>$this::lastQuarter(),
            "This Year"=>$this::thisYear(),
            "Last Year"=>$this::lastYear(),
        ];
    }
}
In above example, we have done:
- Setup the data source for Trend which is the table
payments - Group by time using field
paymentDate - Sum the currency field
amount - Setup the possible range that user can choose from trend metric's selection menu.
The Trend automatically understand user's range selection and divide the range to smaller chunk to aggregate value. For example, if user chooses This Year, trend metric will calculate the sum of amount by month within this year. If user chooses month, it will break into days and calculate sum of amount by day within recent month. Below is rule of range breaking:
- year
=>months - quarter
=>months - month
=>days - week
=>days - day
=>hours
Properties #
| Name | type | default | description |
|---|---|---|---|
defaultRange | string | The default range will be used on the first load when user has not selected any range | |
selectedRange | string | Get/set the name of selected range | |
title | string | Get/set the title of value | |
type | string | Get/set the title of Value metrics | |
ranges | string | Get/set the ranges of menu selection | |
helper | string | Get/set the text that will be shown when user move mouse over the value metrics |
Note: Those above properties follows this code rules.
Aggregates #
The same like Value metrics, Trend support sum(), count(), min(), max() and avg() methods:
Example:
//Sum
$this->sum(
    Number::create("unit"),
)
->decimals(0)
->suffix(" units")

//Average
$this->avg(
    Number::create("vote")
)
->decimal(2)
Ranges #
The same as Value metrics, Trend metrics also support list of built-in date ranges:
    protected function ranges()
    {
        return [
            "Today"=>$this::today(),
            "Yesterday"=>$this::yesterday(),
            "This Week"=>$this::thisWeek(),
            "Las Week"=>$this::lastWeek(),
            "Last 7 Days"=>$this::last7days(),
            "Last 30 Days"=>$this::last30days(),
            "This Month"=>$this::thisMonth(),
            "Last Month"=>$this::lastMonth(),
            "This Quarter"=>$this::thisQuarter(),
            "Last Quarter"=>$this::lastQuarter(),
            "This Year"=>$this::thisYear(),
            "Last Year"=>$this::lastYear(),
        ];
    }
Show latest value #
By default, Trend will show the total amount above the chart, however in some case you do not want the total amount but the latest value, you can do:
    protected function fields()
    {
        return [
            $this->group(
                Date::create("paymentDate")
            ),
            $this->sum(
                Currency::create("amount")->USD()->symbol();
            )
            ->showLatestValue()
        ];
    }
Actions #
actionSelect() #
protected function actionSelect($request, $response)
Above actionSelect method will be called when use select a range in the Trend metric and let you handle the event
Example:
class MyTrend extends Trend
{
    protected function actionSelect($request, $response)
    {
        //Do anything on range select
    }
}
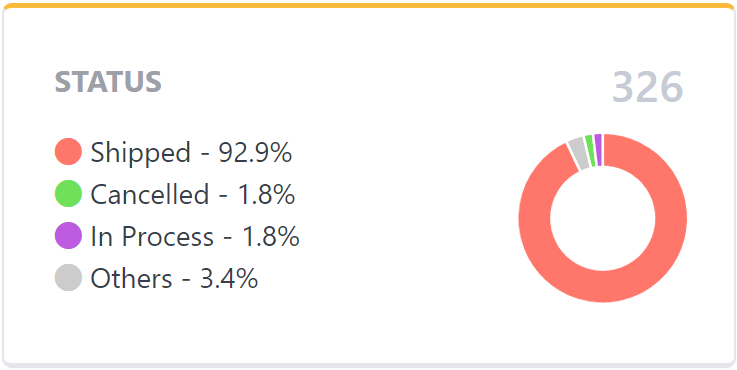
Category #
Category metrics is another type of metric which will display the proportion between categories. It will use pie chart to show the differences in percentage.
Example:
<?php

use \koolreport\dashboard\metrics\Category;
use \koolreport\dashboard\fields\Text;
use \koolreport\dashboard\fields\Number;

class ProductLineStock extends \koolreport\dashboard\metrics\Category
{

    protected function dataSource()
    {
        return AutoMaker::table("products");
    }

    protected function fields()
    {
        return [
            $this->group(Text::create("productLine")),
            $this->sum(Number::create("quantityInStock"))
        ];
    }
}
In above example, we sum the quantityInStock by the productLine and showing on the metrics.
Properties #
| Name | type | default | description |
|---|---|---|---|
type | string | Type of category, accept primary, success, danger, warning, secondary | |
title | string | Title appeared on top of Category | |
colorScheme | array | List of color will be used in Category piechart | |
pieSize | int | 86 | Get/set the size of pie |
showRawValue | boolean | false | Get/set whether category value will be shown in raw value instead of percentage |
helper | string | Get/set the text that will be shown when user move mouse over the category |
Note: Those above properties follows this code rules.
showTop #
By default, Category will list all available categories. But if the list is too long and it is not necessary to show all, you can choose those top to show, you can do:
    protected function fields()
    {
        return [
            $this->group(
                Text::create("productLine")
            )->showTop(3),

            $this->sum(Number::create("quantityInStock"))
        ];
    }
If you want to summarize all out-of-top categories into single "Others", you add andShowOthers($label) method. The $label inside the method is the human-readable label that you give to the out-of-top categories.
    protected function fields()
    {
        return [
            $this->group(
                Text::create("productLine")
            )->showTop(3)
            ->andShowOthers("Others"),
            $this->sum(Number::create("quantityInStock"))
        ];
    }
Show raw value #
By default the legend of category metric will show percentage but if you want to show raw value, you can do:
    protected function fields()
    {
        return [
            $this->group(Text::create("productLine"))
                ->showTop(3)
                ->andShowOthers("Others"),

            $this->sum(Number::create("quantityInStock"))
                ->showRawValue() //To show raw value instead of percentage
        ];
    }
Traits #
All metric widgets have been provided with following traits:
- TAppLink: Able to refer to application with
app()method - TDashboadLink: Able to refer to parent dashboard with
dashboard()method - TEnabledPermit: Use
enabled()andenabledWhen()to set permission - TParams: Able to get/set parameters with
params()method - TWidgetState: Able to get/set persisted state for widget
- TParamsPersisted: Able to make params set to widget persisted
- TDataSource: Able to receive datasource via
dataSource()method - TFields: Able to receive field list via
fields()method
Get started with KoolReport
KoolReport will help you to construct good php data report by gathering your data from multiple sources, transforming them into valuable insights, and finally visualizing them in stunning charts and graphs.